With over 70% of Linux distributions using systemd as their default init system, understanding systemctl logs has become essential for monitoring services, troubleshooting failures, and maintaining system reliability. This comprehensive guide explores systemctl logs from fundamentals to advanced techniques, addressing common challenges like performance issues with large log files, disk space management, and complex troubleshooting workflows.
Understanding systemctl Logs and the systemd Ecosystem
What are systemctl Logs?
systemctl is the primary interface for controlling systemd, which manages services, processes, and system initialization on modern Linux distributions. While systemctl itself doesn't store logs, it provides access to recent log entries through commands like systemctl status and works closely with journalctl for comprehensive log analysis.
The systemd logging ecosystem consists of three key components:
- systemd: The system and service manager
- systemd-journald: The logging daemon that collects and stores logs
- journalctl: The command-line tool for querying and analyzing logs
How systemd Logging Works
systemd-journald aggregates logs from multiple sources into a centralized binary journal:
- Service stdout/stderr: Output from all systemd-managed services
- Kernel messages: Hardware and driver events from
/dev/kmsg - Syslog compatibility: Messages from traditional syslog applications
- Audit logs: Security and access events
- Container logs: When configured with journald logging driver
These logs are stored in /var/log/journal/ (persistent) or /run/log/journal/ (volatile) as structured binary files with rich metadata including timestamps, process IDs, user IDs, and service units.
Basic systemctl Commands for Service Monitoring
Essential Service Management Commands
Here are the fundamental systemctl commands every administrator should master:
Check service status and recent logs:
sudo systemctl status <service-name>
This command displays:
- Current service state (active, inactive, failed)
- Process information and PID
- Recent log entries (last 10 lines by default)
- Service unit file location
Manage service lifecycle:
# Start a service
sudo systemctl start <service-name>

# Stop a service
sudo systemctl stop <service-name>

# Restart a service (stop then start)
sudo systemctl restart <service-name>

# Reload service configuration without restart
sudo systemctl reload <service-name>

# Enable service to start at boot
sudo systemctl enable <service-name>

# Disable service from starting at boot
sudo systemctl disable <service-name>
List and inspect services:
# List all active services
sudo systemctl list-units --type=service

# List all services (active and inactive)
sudo systemctl list-units --type=service --all

# List only failed services
sudo systemctl --failed

# Show service dependencies
sudo systemctl list-dependencies <service-name>
Understanding systemctl status Output
When you run systemctl status, you'll see output like this:
$ sudo systemctl status nginx
● nginx.service - The nginx HTTP and reverse proxy server
   Loaded: loaded (/usr/lib/systemd/system/nginx.service; enabled; vendor preset: disabled)
   Active: active (running) since Mon 2025-07-23 10:30:15 UTC; 2h 15min ago
     Docs: man:nginx(8)
           man:nginx.conf(5)
  Process: 1234 ExecStartPre=/usr/sbin/nginx -t (code=exited, status=0/SUCCESS)
  Process: 1235 ExecStart=/usr/sbin/nginx (code=exited, status=0/SUCCESS)
 Main PID: 1236 (nginx)
    Tasks: 2 (limit: 4915)
   Memory: 4.2M
   CGroup: /system.slice/nginx.service
           ├─1236 nginx: master process /usr/sbin/nginx
           └─1237 nginx: worker process

Jul 23 10:30:15 server systemd[1]: Starting The nginx HTTP and reverse proxy server...
Jul 23 10:30:15 server nginx[1234]: nginx: configuration file /etc/nginx/nginx.conf syntax is ok
Jul 23 10:30:15 server nginx[1234]: nginx: configuration file /etc/nginx/nginx.conf test is successful
Jul 23 10:30:15 server systemd[1]: Started The nginx HTTP and reverse proxy server.
This output provides:
- Service state: Active status and runtime duration
- Unit file: Location and enablement status
- Process information: PIDs and execution status
- Resource usage: Memory consumption and task count
- Recent logs: Last few log entries with timestamps
Advanced Log Viewing with journalctl
While systemctl provides basic log access, journalctl offers comprehensive log analysis capabilities. Understanding journalctl is crucial because it's the primary tool for accessing systemd's binary journal.
Basic journalctl Commands
View all logs:
# Show all journal entries
sudo journalctl

# Follow logs in real-time (like tail -f)
sudo journalctl -f

# Show logs in reverse order (newest first)
sudo journalctl -r
Service-specific log viewing:
# View logs for a specific service
sudo journalctl -u nginx

# View logs for multiple services
sudo journalctl -u nginx -u mysql -u redis

# Follow logs for a specific service in real-time
sudo journalctl -u nginx -f
Time-Based Log Filtering
One of journalctl's most powerful features is precise time-based filtering:
Recent time periods:
# Show logs from the last hour
sudo journalctl --since "1 hour ago"

# Show logs from today
sudo journalctl --since today

# Show logs from yesterday
sudo journalctl --since yesterday

# Show logs from the last 30 minutes
sudo journalctl --since "30 minutes ago"
Specific date ranges:
# Show logs from a specific date
sudo journalctl --since "2025-07-23"

# Show logs between two dates
sudo journalctl --since "2025-07-23 10:00:00" --until "2025-07-23 12:00:00"

# Show logs from last boot session
sudo journalctl -b

# Show logs from previous boot session
sudo journalctl -b -1
Priority-Based Log Filtering
Filter logs by severity level to focus on critical issues:
# Show only error level and higher (err, crit, alert, emerg)
sudo journalctl -p err

# Show warning level and higher
sudo journalctl -p warning

# Show specific priority range
sudo journalctl -p err..alert

# Combine with service filtering
sudo journalctl -u nginx -p err
Priority levels in order of severity:
emerg(0): System unusablealert(1): Action must be taken immediatelycrit(2): Critical conditionserr(3): Error conditionswarning(4): Warning conditionsnotice(5): Normal but significant conditionsinfo(6): Informational messagesdebug(7): Debug-level messages
Advanced Filtering Techniques
Filter by process ID or user:
# Show logs for specific PID
sudo journalctl _PID=1234

# Show logs for specific user
sudo journalctl _UID=1000

# Show logs for specific executable
sudo journalctl /usr/sbin/nginx
Combine multiple filters:
# Service logs with time range and priority
sudo journalctl -u nginx --since "1 hour ago" -p warning

# Multiple services with error priority in the last day
sudo journalctl -u nginx -u apache2 --since "1 day ago" -p err
Output formatting options:
# Show logs in JSON format
sudo journalctl -u nginx -o json

# Show logs in verbose format with all fields
sudo journalctl -u nginx -o verbose

# Show logs with short format (no hostname)
sudo journalctl -u nginx -o short

# Export logs for external processing
sudo journalctl -u nginx --output=json | jq '.'
Comprehensive Troubleshooting Workflows
Systematic Service Failure Diagnosis
When a service fails, follow this systematic approach:
1. Initial status check:
sudo systemctl status <service-name>
Look for:
- Exit codes and signal information
- Recent error messages
- Process state and timing
2. Examine detailed logs:
# View comprehensive service logs
sudo journalctl -u <service-name> --no-pager

# Focus on recent failures
sudo journalctl -u <service-name> --since "1 hour ago" -p err
3. Check service configuration:
# Verify service unit file
sudo systemctl cat <service-name>

# Check configuration syntax (if applicable)
sudo nginx -t  # for nginx
sudo apache2ctl configtest  # for Apache
4. Analyze dependencies:
# Check service dependencies
sudo systemctl list-dependencies <service-name>

# Check reverse dependencies (what depends on this service)
sudo systemctl list-dependencies <service-name> --reverse
Boot-Time Issue Diagnosis
Boot problems require special attention and specific journalctl techniques:
Analyze current boot:
# Show all logs from current boot
sudo journalctl -b

# Show only error and critical messages from boot
sudo journalctl -b -p err

# Show boot time and performance
systemd-analyze

# Show detailed boot timing
systemd-analyze blame
Analyze previous boots:
# List available boot sessions
sudo journalctl --list-boots

# Show logs from previous boot
sudo journalctl -b -1

# Show failed services from previous boot
sudo journalctl -b -1 --failed
Boot performance analysis:
# Generate boot performance plot
systemd-analyze plot > boot-analysis.svg

# Show critical chain (longest startup path)
systemd-analyze critical-chain

# Show service startup times
systemd-analyze blame | head -20
Performance and Resource Monitoring
Monitor service resource usage:
# Show current resource usage
systemctl status <service-name>

# Monitor resource usage over time
sudo systemctl show <service-name> --property=MainPID
sudo top -p <PID>

# Check service limits and constraints
sudo systemctl show <service-name> --property=LimitNOFILE,LimitNPROC,MemoryLimit
Analyze log performance issues:
# Check journal size and usage
sudo journalctl --disk-usage

# Verify journal performance
sudo systemctl status systemd-journald

# Monitor journal writing activity
sudo journalctl -u systemd-journald -f
Log Storage and Rotation Management
Understanding Journal Storage
systemd journal storage is configured in /etc/systemd/journald.conf:
[Journal]
Storage=persistent          # Options: auto, volatile, persistent, none
Compress=yes               # Compress logs to save space
Seal=yes                   # Add authentication data
SplitMode=uid              # Split logs by user ID
SyncIntervalSec=5m         # Sync interval for safety
RateLimitInterval=30s      # Rate limiting
RateLimitBurst=1000        # Burst limit
SystemMaxUse=4G            # Maximum disk usage
SystemKeepFree=1G          # Keep free disk space
SystemMaxFileSize=128M     # Maximum file size
MaxRetentionSec=1month     # Maximum retention time
MaxFileSec=1week           # Maximum time per file
ForwardToSyslog=no         # Forward to traditional syslog
ForwardToKMsg=no           # Forward to kernel log
ForwardToConsole=no        # Forward to console
Manual Log Cleanup
Check current journal usage:
# Show disk usage
sudo journalctl --disk-usage

# Show journal files
sudo journalctl --list-boots
ls -lah /var/log/journal/*/
Clean up logs:
# Delete logs older than 2 weeks
sudo journalctl --vacuum-time=2weeks

# Keep only 1GB of logs
sudo journalctl --vacuum-size=1G

# Keep only last 10 boot sessions
sudo journalctl --vacuum-files=10

# Rotate journal files immediately
sudo systemctl kill --kill-who=main --signal=SIGUSR2 systemd-journald
Verify log integrity:
# Check journal file integrity
sudo journalctl --verify

# Show detailed journal statistics
sudo journalctl --header
Real-World Troubleshooting Case Studies
Case Study 1: Diagnosing Service Startup Failures
Scenario: A web application service fails to start after system reboot.
Investigation steps:
Initial assessment:
sudo systemctl status webapp.serviceOutput shows:
failed (Result: exit-code)Examine recent logs:
sudo journalctl -u webapp.service --since "boot" -p errReveals:
bind: Address already in useCheck port usage:
sudo netstat -tlnp | grep :8080
sudo journalctl _COMM=webapp --since "boot"
Finds another process using port 8080
Analyze service dependencies:
sudo systemctl list-dependencies webapp.serviceShows missing database dependency
Resolution:
sudo systemctl start postgresql
sudo systemctl start webapp.service
sudo systemctl enable postgresql  # Ensure it starts at boot
Case Study 2: Performance Issues with Large Logs
Scenario: systemctl status commands become slow (10+ seconds) on production server.
Investigation:
Check journal size:
sudo journalctl --disk-usage
# Output: Archived and active journals take up 15.2G in the file system.
Identify problematic services:
# Find services generating most logs
sudo journalctl --since "1 day ago" | awk '{print $5}' | sort | uniq -c | sort -nr | head -10
Examine specific service:
sudo journalctl -u chatty-service --since "1 hour ago" | wc -l
# Output: 50000 (excessive logging)
Implement solution:
# Immediate cleanup
sudo journalctl --vacuum-time=3days
sudo journalctl --vacuum-size=2G

# Configure rate limiting in /etc/systemd/journald.conf
RateLimitInterval=10s
RateLimitBurst=200

# Restart journald
sudo systemctl restart systemd-journald

# Fix application logging level
# Configure chatty-service to use less verbose logging
Case Study 3: Container Service Troubleshooting
Scenario: Docker containers managed by systemd are crashing intermittently.
Investigation:
Check container service status:
sudo systemctl status docker-myapp.serviceAnalyze container logs:
# systemd service logs
sudo journalctl -u docker-myapp.service -f

# Docker container logs
sudo docker logs myapp-container

# Combine both perspectives
sudo journalctl -u docker.service -u docker-myapp.service --since "1 hour ago"
Monitor resource constraints:
# Check for OOM kills
sudo journalctl -k | grep -i "killed process"

# Monitor memory usage
sudo systemctl show docker-myapp.service --property=MemoryCurrent,MemoryMax
Resolution:
# Increase memory limits in service unit file
sudo systemctl edit docker-myapp.service
# Add:
# [Service]
# MemoryLimit=2G

sudo systemctl daemon-reload
sudo systemctl restart docker-myapp.service
Common systemctl Log Messages and Solutions
Service State Messages
Service started successfully:
Started [service-name].service
Meaning: Service initialization completed successfully. Action: None required - normal operation.
Service stopped:
Stopped [service-name].service
Meaning: Service shutdown completed normally. Action: Check if shutdown was intended.
Service failed to start:
Failed to start [service-name].service
Job for [service-name].service failed because the control process exited with error code
Meaning: Service startup failed due to configuration or dependency issues. Action:
sudo journalctl -u [service-name] --no-pager
sudo systemctl status [service-name] -l
Process and Exit Code Messages
Main process exited:
[service-name]: Main process exited, code=exited, status=1/FAILURE
Meaning: Service process terminated with non-zero exit code. Action: Check application logs and configuration:
sudo journalctl -u [service-name] -p err
Process killed by signal:
[service-name]: Main process exited, code=killed, status=9/KILL
Meaning: Process was forcibly terminated (often due to OOM or manual kill). Action: Check system resources and memory usage:
sudo journalctl -k | grep -i "killed process"
dmesg | grep -i "out of memory"
Start operation timed out:
[service-name]: start operation timed out. Terminating.
Meaning: Service took too long to initialize. Action: Increase timeout or check for blocking operations:
sudo systemctl edit [service-name]
# Add: [Service]
# TimeoutStartSec=300
Dependency and Configuration Issues
Dependency failed:
Dependency failed for [service-name].service
Meaning: A required service or resource is unavailable. Action: Check dependencies:
sudo systemctl list-dependencies [service-name]
sudo systemctl status [dependency-name]
Unit file syntax error:
[service-name].service: Failed to parse service file
Meaning: Syntax error in the systemd unit file. Action: Validate unit file:
sudo systemd-analyze verify /etc/systemd/system/[service-name].service
Permission denied:
[service-name]: Failed to execute command: Permission denied
Meaning: Service lacks necessary permissions. Action: Check file permissions and SELinux/AppArmor:
ls -la /path/to/executable
sudo journalctl | grep -i selinux
Advanced Filtering and Analysis Techniques
Complex Query Construction
Multi-dimensional filtering:
# Combine service, time, and priority filters
sudo journalctl -u nginx -u apache2 --since "2 hours ago" --until "1 hour ago" -p warning..err

# Filter by multiple process characteristics
sudo journalctl _SYSTEMD_UNIT=sshd.service _PID=1234 --since today

# Use field-based filtering for specific analysis
sudo journalctl SYSLOG_IDENTIFIER=kernel --since "boot" -p crit
Pattern matching and grep integration:
# Find specific error patterns
sudo journalctl -u webapp.service | grep -i "database\|connection\|timeout"

# Search for IP addresses in logs
sudo journalctl --since "1 hour ago" | grep -E '\b([0-9]{1,3}\.){3}[0-9]{1,3}\b'

# Monitor authentication failures
sudo journalctl -u sshd.service | grep "Failed password"
Log Export and Processing
Export logs for analysis:
# Export to JSON for processing
sudo journalctl -u nginx --since today -o json > nginx-logs.json

# Export specific fields
sudo journalctl -u nginx -o json | jq -r '.MESSAGE'

# Create CSV format for spreadsheet analysis
sudo journalctl -u nginx --since today -o json | jq -r '[.__REALTIME_TIMESTAMP, .MESSAGE] | @csv'
Automated log analysis scripts:
#!/bin/bash
# analyze-service-errors.sh
SERVICE=$1
TIME_RANGE=${2:-"1 hour ago"}

echo "Error Analysis for $SERVICE since $TIME_RANGE"
echo "================================================"

# Count error types
sudo journalctl -u "$SERVICE" --since "$TIME_RANGE" -p err -o json | \
jq -r '.MESSAGE' | sort | uniq -c | sort -rn

# Show error timeline
sudo journalctl -u "$SERVICE" --since "$TIME_RANGE" -p err -o short-iso
Integration with Monitoring and Alerting Systems
Setting Up Log-Based Alerts
Using systemd OnFailure for immediate alerts:
# /etc/systemd/system/myapp.service
[Unit]
Description=My Application
OnFailure=alert-handler@%n.service

[Service]
Type=simple
ExecStart=/usr/local/bin/myapp
Restart=always
RestartSec=5

[Install]
WantedBy=multi-user.target
Create alert handler service:
# /etc/systemd/system/alert-handler@.service
[Unit]
Description=Alert Handler for %I

[Service]
Type=oneshot
ExecStart=/usr/local/bin/send-alert.sh %I
Centralized Log Management with SigNoz
While systemctl and journalctl provide excellent local log management, modern infrastructure requires centralized logging for multiple servers and services. SigNoz addresses the limitations of traditional log management by providing:
Centralized Log Aggregation: Unlike journalctl which requires logging into each host individually, SigNoz aggregates logs from multiple Linux systems into a single platform. This is particularly valuable in containerized environments and multi-server deployments.
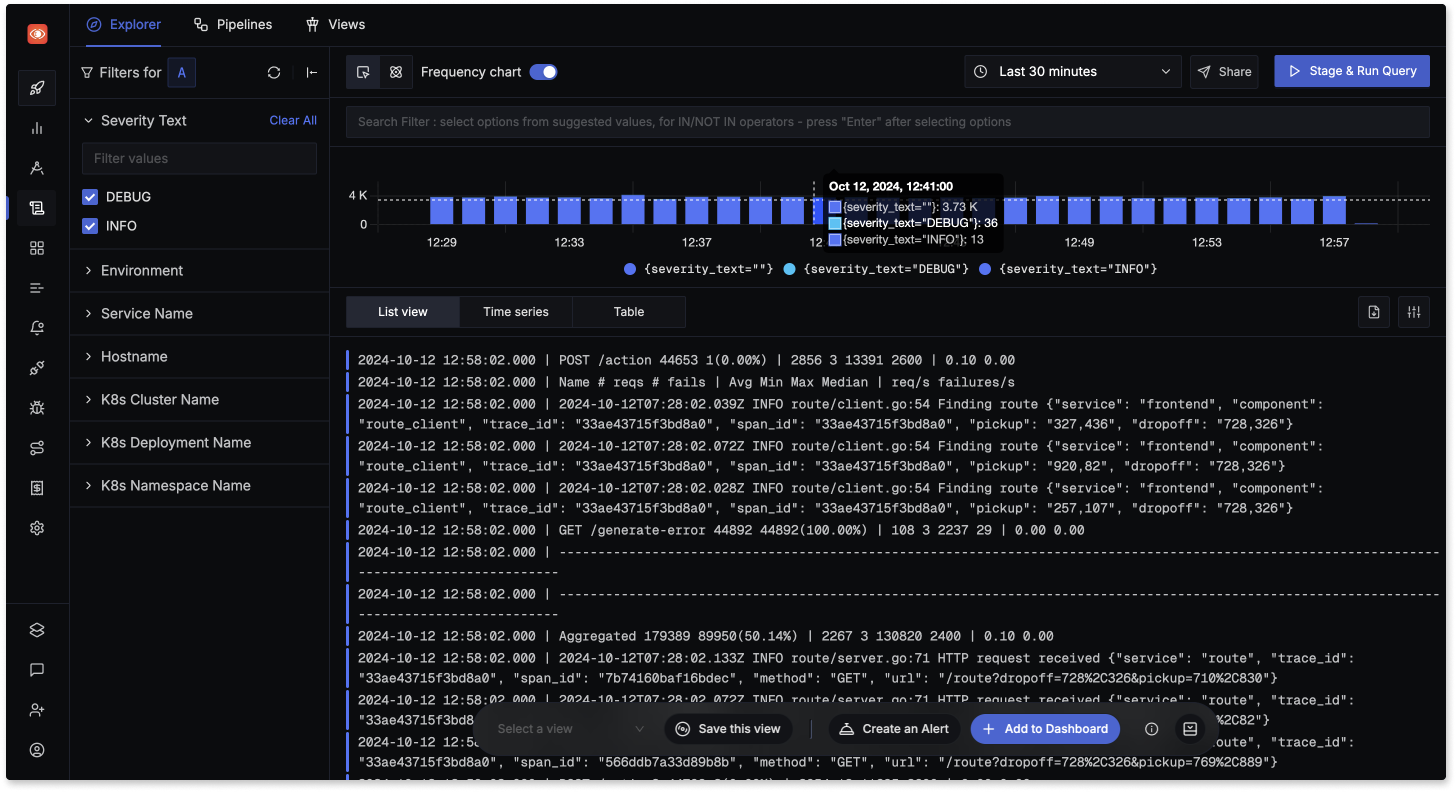
Advanced Visualization: SigNoz transforms plain text logs into visual dashboards with charts, graphs, and real-time monitoring capabilities that make pattern identification much easier than command-line analysis.
Correlation with Metrics and Traces: SigNoz consolidates logs alongside metrics and distributed traces in one interface, enabling deeper root cause analysis for system and application issues that span multiple services.
OpenTelemetry Integration: SigNoz natively supports OpenTelemetry standards, allowing you to collect systemd logs through OpenTelemetry Collectors while maintaining compatibility with existing Linux logging infrastructure.
Real-time Monitoring and Alerting: While journalctl provides live log tailing with -f, SigNoz extends this with intelligent alerting based on log patterns, error rates, and custom queries across your entire infrastructure.
Here's how you can integrate systemd logs with SigNoz using OpenTelemetry Collector:
- Install and configure OpenTelemetry Collector:
# otel-collector-config.yaml
receivers:
  filelog:
    include:
      - /var/log/journal/*/*.journal
    operators:
      - type: journal_parser

processors:
  batch:
    timeout: 1s
    send_batch_size: 1024

exporters:
  otlp:
    endpoint: "http://your-signoz-endpoint:4317"
    insecure: true

service:
  pipelines:
    logs:
      receivers: [filelog]
      processors: [batch]
      exporters: [otlp]
- Configure systemd to forward logs:
# Enable persistent journal storage
sudo mkdir -p /var/log/journal
sudo systemctl restart systemd-journald

# Set appropriate permissions
sudo chown root:systemd-journal /var/log/journal
sudo chmod 2755 /var/log/journal
- Use journalctl to stream logs to SigNoz (alternative approach):
# Stream specific service logs
journalctl -u your-service -f --output=json | \
curl -X POST "http://your-signoz-endpoint:8080/logs" \
  -H "Content-Type: application/json" \
  --data-binary @-
Getting Started with SigNoz
SigNoz enhances Linux system monitoring by integrating with standard logging tools like systemctl and journalctl, providing comprehensive log management, real-time streaming, and analytical capabilities beyond native systemd logs.
You can choose between various deployment options in SigNoz. The easiest way to get started with SigNoz is SigNoz cloud. We offer a 30-day free trial account with access to all features including comprehensive log management for systemctl and journalctl logs.
Those who have data privacy concerns and can't send their data outside their infrastructure can sign up for either enterprise self-hosted or BYOC offering.
Those who have the expertise to manage SigNoz themselves or just want to start with a free self-hosted option can use our community edition.
Best Practices and Security Considerations
Log Security and Access Control
Protect sensitive information in logs:
# Configure journald to limit log access
sudo chmod 640 /var/log/journal/*/*
sudo chown root:systemd-journal /var/log/journal/*/*

# Use systemd user sessions for application isolation
loginctl list-sessions
journalctl --user -u user-service
Implement log rotation policies:
# /etc/systemd/journald.conf
[Journal]
SystemMaxUse=2G
SystemKeepFree=500M
SystemMaxFileSize=100M
MaxRetentionSec=1month
MaxFileSec=1week
Compress=yes
Seal=yes
Performance Optimization
Optimize journal performance:
# Monitor journal performance impact
systemctl status systemd-journald
journalctl -u systemd-journald --since "1 hour ago"

# Configure rate limiting for verbose services
# In service unit file:
[Service]
StandardOutput=journal
StandardError=journal
SyslogLevel=info  # Reduce verbosity
Efficient log querying practices:
# Use specific time ranges to limit data processing
sudo journalctl -u service --since "1 hour ago" --until "30 minutes ago"

# Leverage binary format advantages
sudo journalctl -u service -o json-pretty | head -100

# Use field-specific queries when possible
sudo journalctl _SYSTEMD_UNIT=nginx.service --since today
Troubleshooting Common Issues
Performance Problems
Slow systemctl status commands:
- Check journal size:
sudo journalctl --disk-usage - Clean up old logs:
sudo journalctl --vacuum-time=1week - Configure size limits in
/etc/systemd/journald.conf - Monitor I/O impact:
sudo iotopduring log operations
High disk usage from logs:
- Implement automatic retention:
SystemMaxUse=1Gin journald.conf - Use compression:
Compress=yes - Monitor with:
sudo journalctl --disk-usage - Set up monitoring alerts for disk space
Access and Permission Issues
Permission denied errors:
# Add user to systemd-journal group
sudo usermod -a -G systemd-journal username

# For systemd user services
loginctl enable-linger username
journalctl --user -u user-service
Missing logs or delayed updates:
# Force journal sync
sudo systemctl kill --kill-who=main --signal=SIGUSR1 systemd-journald

# Check journal service status
sudo systemctl status systemd-journald

# Verify journal files
sudo journalctl --verify
Key Takeaways
Mastering systemctl logs requires understanding the relationship between systemctl, systemd, and journalctl, along with practical troubleshooting workflows that address real-world challenges:
Essential Skills:
- Use
systemctl statusfor quick service overview and recent logs - Leverage
journalctlfor comprehensive log analysis with time-based, priority, and field-specific filtering - Implement systematic troubleshooting workflows for service failures and performance issues
Performance Management:
- Configure journal storage limits to prevent disk space issues
- Use rate limiting to control verbose services
- Implement efficient querying practices for large log volumes
Advanced Capabilities:
- Combine multiple filtering criteria for precise log analysis
- Export logs in structured formats for external processing
- Integrate with monitoring systems for proactive incident management
Operational Excellence:
- Establish log retention policies that balance storage costs with troubleshooting needs
- Implement centralized logging solutions like SigNoz for multi-server environments
- Create automated alerting based on service state changes and log patterns
The systemd logging ecosystem provides powerful capabilities for modern Linux administration, but reaching its full potential requires understanding both fundamental commands and advanced techniques.
Frequently Asked Questions
How to see systemctl services logs?
To view logs for a specific service, use sudo systemctl status <service-name> for recent entries or sudo journalctl -u <service-name> for comprehensive logs.
Where are systemctl logs stored?
systemctl itself doesn't store logs. Logs are managed by systemd-journald and stored in /var/log/journal/ (persistent) or /run/log/journal/ (volatile) directories depending on configuration.
What is systemctl in Linux?
systemctl is a command-line utility for managing systemd, which controls system services with commands for status, start, stop, enable, disable, and dependency management.
How do I open service logs?
Open service logs using sudo journalctl -u <service-name> to view all logs for a specific service, or add -f flag for real-time following.
How do I view logs in Linux?
View logs using journalctl for systemd logs or access files in /var/log/ directory using commands like cat, less, or tail.
How to check systemctl service restart logs?
Use sudo journalctl -u <service-name> | grep -E "(Started|Stopped|Reloading)" to see service restart events, or sudo journalctl -u <service-name> --since "boot" for current session activity.
What causes slow systemctl status commands?
Slow performance is typically caused by large journal files (>10GB). Clean up with sudo journalctl --vacuum-time=1week and configure size limits in /etc/systemd/journald.conf.
How do I clean up systemd journal logs?
Use sudo journalctl --vacuum-time=2weeks to delete old logs, sudo journalctl --vacuum-size=1G to limit total size, or configure automatic cleanup in journald.conf.
Can I filter logs by multiple services simultaneously?
Yes, use sudo journalctl -u service1 -u service2 -u service3 to view logs from multiple services in chronological order.
How do I analyze boot-time service failures?
Use sudo journalctl -b -p err for current boot errors, sudo journalctl -b -1 for previous boot logs, and systemd-analyze blame for startup timing analysis.
