When containers fail or behave unexpectedly, real-time log access becomes your first line of defense. Docker's native logging provides the foundation, but understanding its capabilities, limitations, and performance characteristics is crucial for effective troubleshooting and monitoring in production environments.
This guide covers Docker log tailing from basic commands through advanced monitoring solutions that address the scalability and performance challenges of native Docker logging.
Docker Logs Architecture
Docker captures application output streams (stdout and stderr) through configurable logging drivers. The default json-file driver writes JSON-formatted logs to /var/lib/docker/containers/<container_id>/<container_id>-json.log on the host filesystem.
Logging Driver Impact on Performance
Different logging drivers have varying performance characteristics and docker logs compatibility:
| Driver | Performance | docker logs Support | Use Case |
|---|---|---|---|
| json-file | Good for small files, degrades with size | ✅ Full support | Development, small deployments |
| syslog | Low overhead, network dependent | ❌ Use syslog tools | System integration |
| journald | Moderate overhead, structured | ✅ Supported | systemd environments |
| fluentd | Network overhead, async | ❌ Use Fluentd interface | Production aggregation |
The choice of logging driver directly impacts both performance and available tooling for log access.
Essential Docker Log Tailing Commands
Basic Container Log Access
First, identify your target container:
docker ps                    # Running containers
docker ps -a                 # All containers
Core Tailing Syntax
Stream real-time logs with the follow flag:
docker logs -f <container_id_or_name>
Limit initial output to prevent overwhelming your terminal:
# Show last 100 lines, then follow new entries
docker logs -f --tail 100 <container_id>

# Include timestamps for correlation
docker logs -f --tail 100 -t <container_id>
Time-Based Filtering
Filter logs by time ranges using --since and --until:
# Last 5 minutes
docker logs --since 5m <container_id>

# Specific time range
docker logs --since "2025-07-23T10:00:00" --until "2025-07-23T11:00:00" <container_id>

# Combined with tailing
docker logs -f --since 30m --tail 50 <container_id>
Supported time formats:
- Relative:
5m,2h,1d - RFC3339:
2025-07-23T10:00:00Z - Unix timestamps:
1642780800
Content Filtering with grep
Pipe Docker logs through standard Unix tools for content filtering:
# Error filtering
docker logs -f <container_id> | grep -i error

# Multiple patterns with context
docker logs -f <container_id> | grep -E "(error|warning|critical)" -C 3

# Count specific events
docker logs <container_id> | grep -c "ERROR"
Multi-Container Log Management
Docker Compose Logging
Manage logs across multiple services in Compose deployments:
# All services
docker compose logs -f

# Specific services
docker compose logs -f web database redis

# With line limits and timestamps
docker compose logs -f --tail 100 -t
Service-Level Logging in Swarm
For Docker Swarm deployments:
# Service logs across all replicas
docker service logs -f webapp_service

# Specific task filtering
docker service logs -f --since 30m webapp_service
Performance Optimization and Limitations
Large Log File Performance Issues
Docker's linear search mechanism causes significant performance degradation with large log files. The --tail command becomes extremely slow as it processes entire files to count lines from the end.
Problem: docker logs --tail 1000 on a 2GB log file can take several minutes.
Solutions:
Use time-based filtering instead of line counting:
# Instead of: docker logs --tail 10000 <container>
# Use: docker logs --since 30m <container>
Configure log rotation at container level:
docker run --log-opt max-size=50m --log-opt max-file=5 nginxSet daemon-wide defaults in
/etc/docker/daemon.json:{ "log-driver": "json-file", "log-opts": { "max-size": "10m", "max-file": "3", "compress": "true" } }
Resource Impact Monitoring
Extended docker logs -f sessions consume system resources:
- File descriptors: May leak with prolonged sessions
- Memory usage: Large tail operations require significant memory
- I/O impact: Continuous reading affects disk performance
Monitor these impacts:
# Check log file sizes
du -sh /var/lib/docker/containers/*/

# Monitor file descriptor usage
lsof | grep docker | wc -l
Troubleshooting Common Issues
Hanging or Unresponsive Commands
Symptoms: docker logs --tail hangs indefinitely.
Diagnosis:
# Check container status
docker ps -a | grep <container_id>

# Verify log file existence and permissions
ls -la /var/lib/docker/containers/<container_id>/

# Test with minimal tail
docker logs --tail 1 <container_id>
Solutions:
- Restart Docker daemon if persistent:
sudo systemctl restart docker - Check filesystem space and permissions
- Verify container hasn't been manually modified
Missing Log Entries
Common causes:
- Application logging to files instead of stdout/stderr
- TTY allocation race conditions
- Logging driver rate limiting
Diagnostic steps:
# Check if app logs to files
docker exec <container> find / -name "*.log" 2>/dev/null

# Verify logging configuration
docker inspect <container> | jq '.[0].HostConfig.LogConfig'

# Test without TTY
docker logs -f <container>  # Remove -t flag
Logging Driver Incompatibility
When using non-json-file drivers, docker logs may not work:
# Check container's logging driver
docker inspect <container> | jq '.[0].HostConfig.LogConfig.Type'
Alternative access methods:
- syslog:
journalctl -f CONTAINER_NAME=<name> - journald:
journalctl -fu docker.service - fluentd: Access through Fluentd aggregation interface
Advanced Monitoring with SigNoz
While docker logs -f provides basic functionality, production environments require more sophisticated log management. SigNoz offers comprehensive observability that addresses Docker logging limitations through structured log aggregation, correlation with metrics and traces, and advanced query capabilities.
Key Advantages Over Native Docker Logging
Centralized Multi-Container Monitoring: Instead of managing multiple docker logs -f sessions, SigNoz provides a unified interface for all container logs with cross-container search capabilities.
Performance at Scale: SigNoz handles high-volume logging without the linear search performance degradation that affects Docker's native commands with large log files.
Log Correlation: Correlate logs with distributed traces and metrics to understand the complete context of issues, not just isolated log entries.
Advanced Querying: Use structured queries instead of chaining grep commands for complex log analysis.
Setting Up Docker Log Monitoring
Configure comprehensive monitoring using SigNoz's OpenTelemetry-based approach:
1. Environment Configuration
Create a .env file with your SigNoz credentials:
OTEL_COLLECTOR_ENDPOINT=ingest.{region}.signoz.cloud:443
SIGNOZ_INGESTION_KEY=your_ingestion_key
2. OpenTelemetry Collector Configuration
Create otel-collector-config.yaml:
receivers:
  tcplog/docker:
    listen_address: "0.0.0.0:2255"
    operators:
      - type: regex_parser
        regex: '^<([0-9]+)>[0-9]+ (?P<timestamp>[0-9]{4}-[0-9]{2}-[0-9]{2}T[0-9]{2}:[0-9]{2}:[0-9]{2}(\\.[0-9]+)?([zZ]|([\\+-])([01]\\d|2[0-3]):?([0-5]\\d)?)?) (?P<container_id>\\S+) (?P<container_name>\\S+) [0-9]+ - -( (?P<body>.*))?'
        timestamp:
          parse_from: attributes.timestamp
          layout: "%Y-%m-%dT%H:%M:%S.%LZ"
      - type: move
        from: attributes["body"]
        to: body

processors:
  batch:
    send_batch_size: 10000
    timeout: 10s

exporters:
  otlp:
    endpoint: ${env:OTEL_COLLECTOR_ENDPOINT}
    tls:
      insecure: false
    headers:
      "signoz-ingestion-key": ${env:SIGNOZ_INGESTION_KEY}

service:
  pipelines:
    logs:
      receivers: [tcplog/docker]
      processors: [batch]
      exporters: [otlp]
3. Docker Compose Integration
Add monitoring components to your existing docker-compose.yml:
services:
  # Your existing services here

  otel-collector:
    image: signoz/signoz-otel-collector:v0.111.42
    container_name: signoz-otel-collector
    command:
      - "--config=/etc/otel-collector-config.yaml"
    volumes:
      - ./otel-collector-config.yaml:/etc/otel-collector-config.yaml
    env_file:
      - ./.env
    ports:
      - "4317:4317"
      - "4318:4318"

  logspout:
    image: "gliderlabs/logspout:v3.2.14"
    container_name: signoz-logspout
    volumes:
      - /var/run/docker.sock:/var/run/docker.sock
    command: syslog+tcp://otel-collector:2255
    depends_on:
      - otel-collector
4. Deploy and Monitor
Start your monitoring stack:
docker compose up -d
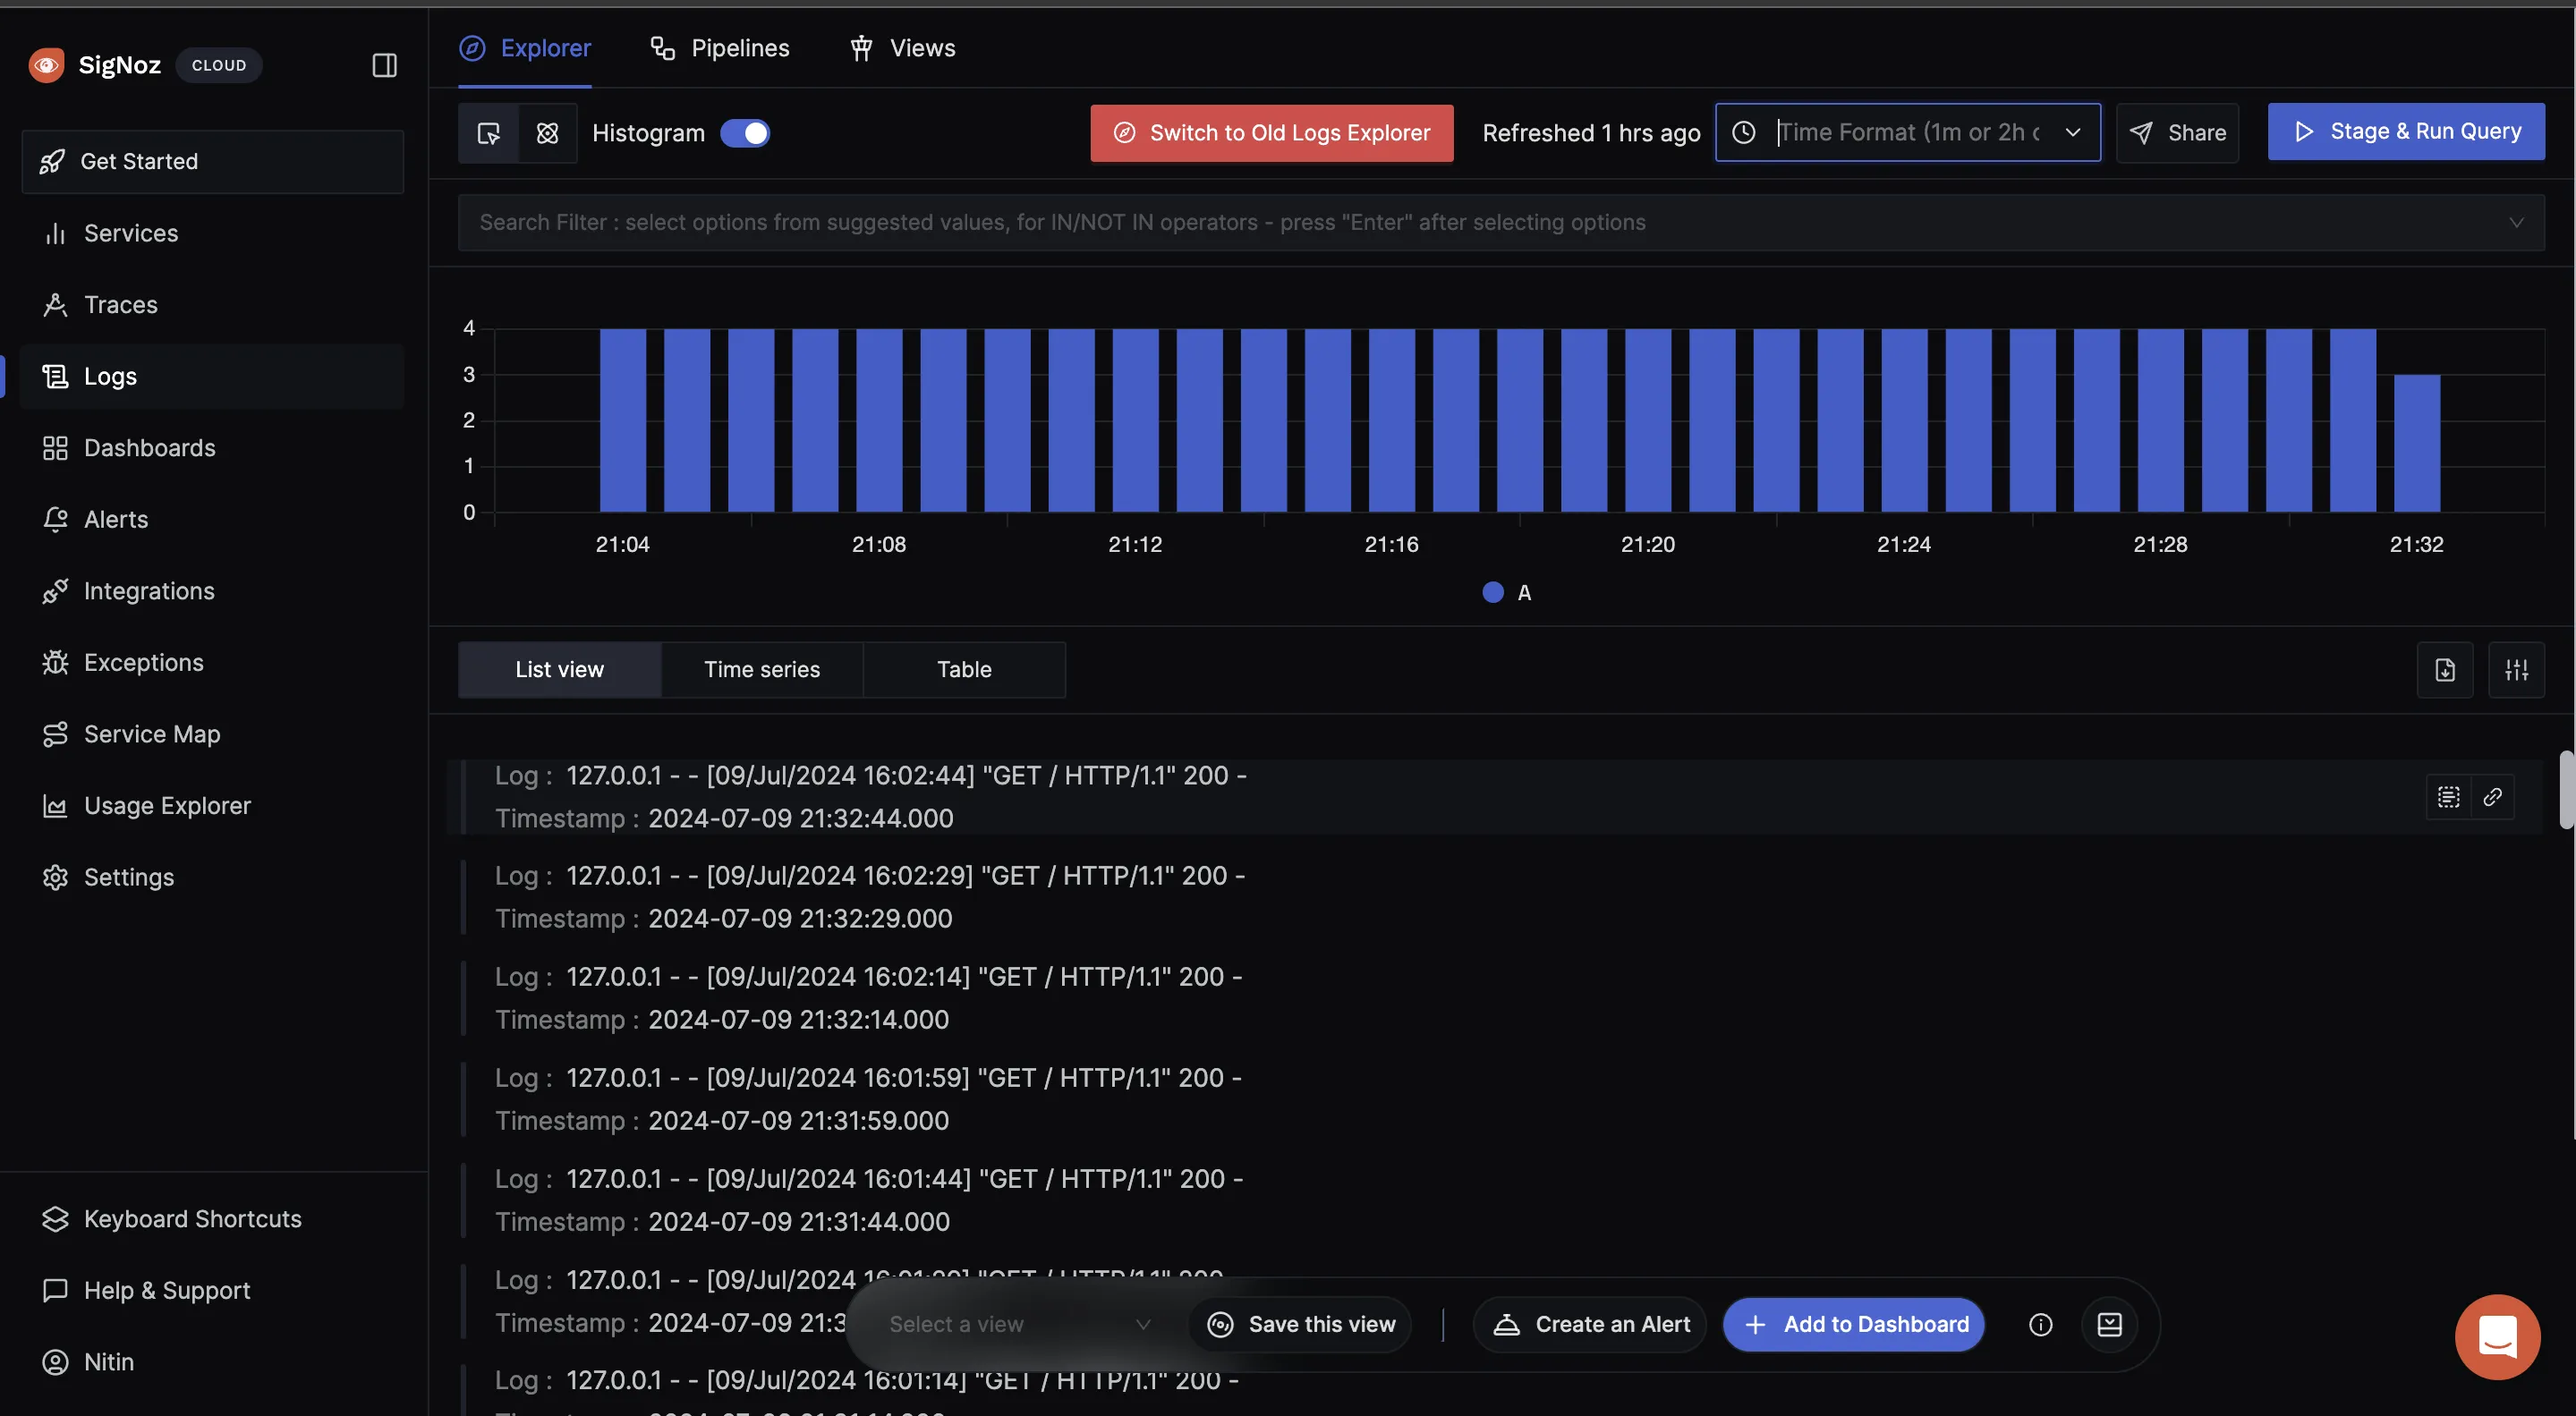
Access your SigNoz dashboard to view centralized logs with advanced filtering, search, and correlation capabilities.
Production Monitoring Features
SigNoz provides enterprise-grade capabilities beyond basic log tailing:
- Real-time log search across all containers
- Log aggregation with efficient storage and querying
- Custom dashboards combining logs, metrics, and traces
- Intelligent alerting based on log patterns and error rates
- Distributed tracing to correlate logs with request flows
- Performance monitoring with automatic anomaly detection
Alternative Approaches
Sidecar Container Pattern
Deploy dedicated log shipping containers:
services:
  app:
    image: nginx
    volumes:
      - logs:/var/log/nginx

  log-shipper:
    image: fluentd
    volumes:
      - logs:/fluentd/log
    environment:
      - FLUENTD_CONF=fluent.conf

volumes:
  logs:
Kubernetes Native Solutions
For Kubernetes deployments:
# Pod logs with follow
kubectl logs -f pod/webapp-pod

# Deployment logs across all pods
kubectl logs -f deployment/webapp --max-log-requests=10

# Previous container logs
kubectl logs webapp-pod --previous
Get Started with SigNoz
For production Docker environments, centralized log monitoring provides significant advantages over native tailing commands. SigNoz offers comprehensive observability with log aggregation, correlation, and advanced analytics capabilities.
You can choose between various deployment options in SigNoz. The easiest way to get started with SigNoz is SigNoz cloud. We offer a 30-day free trial account with access to all features.
Those who have data privacy concerns and can't send their data outside their infrastructure can sign up for either enterprise self-hosted or BYOC offering.
Those who have the expertise to manage SigNoz themselves or just want to start with a free self-hosted option can use our community edition.
Hope we answered all your questions regarding Docker log tailing. If you have more questions, feel free to use the SigNoz AI chatbot, or join our slack community.
Key Takeaways
Docker log tailing provides essential debugging capabilities, but understanding its limitations is crucial for production use:
- Performance degrades significantly with large log files due to linear search mechanisms
- Time-based filtering (
--since) performs better than line counting (--tail) for large datasets - Log rotation configuration prevents disk space exhaustion and maintains performance
- Centralized logging solutions like SigNoz address scalability and correlation requirements
- Multiple logging drivers have different performance characteristics and tool compatibility
For multi-container applications and production environments, native Docker logging should be augmented with dedicated observability platforms that provide structured querying, correlation, and advanced analytics capabilities.
Frequently Asked Questions
Can you tail Docker logs?
Yes, use docker logs -f <container_id> to stream real-time log output. This works similarly to the Unix tail -f command for monitoring container activity.
What is the use of --tail flag in docker logs --tail 100?
The --tail flag limits output to the most recent N lines from the log history. docker logs --tail 100 <container_id> displays the last 100 lines, useful for accessing recent logs without processing entire log files.
How do I check Docker logs?
Use docker logs <container_id_or_name> for basic log viewing. Add -f for real-time streaming, -t for timestamps, and --tail N to limit output lines.
Where do Docker logs go?
Default location is /var/lib/docker/containers/<container_id>/<container_id>-json.log on the host system. Each container maintains separate log files in this directory structure.
Are Docker logs persistent?
Docker logs persist until the container is removed. Without log rotation, they can consume significant disk space. Configure rotation with --log-opt max-size and --log-opt max-file options.
How do you tail logs continuously?
Use docker logs -f <container_id> where -f (follow) keeps the command open and streams new entries in real-time as the container generates them.
What does tail logs do?
Tailing displays the most recent log entries and continues monitoring for new additions. docker logs --tail N shows the last N lines, while adding -f provides continuous monitoring.
What is tail vs head logs?
tail shows recent (end) entries, while head shows oldest (beginning) entries. Docker supports --tail but not --head - default behavior shows from the beginning chronologically.
How do I exit from Docker logs?
Press Ctrl + C to exit docker logs -f (follow mode). This stops log streaming and returns to the command prompt without affecting the running container.
Where are Docker images stored?
Docker images are stored in /var/lib/docker/ organized by storage driver (typically overlay2). The exact structure depends on the configured storage driver.
Can I delete Docker container logs?
Yes, truncate logs with: truncate -s 0 /var/lib/docker/containers/<container_id>/<container_id>-json.log. However, proper log rotation and external shipping are recommended for production.
How to extract logs from Docker container?
Save logs to files using output redirection: docker logs <container_id> > logs.txt. For time-based extraction: docker logs --since 24h <container_id> > daily_logs.txt.
