NestJS applications require comprehensive monitoring to ensure optimal performance and rapid issue resolution.
As your application grows—spanning multiple services, databases, and external APIs—understanding what's happening under the hood becomes critical. That's where OpenTelemetry comes in.
OpenTelemetry provides vendor-agnostic observability for your NestJS applications through distributed tracing, metrics, and logs. Unlike traditional logging, which only tells you what happened at a specific point, distributed tracing shows you the complete journey of a request across your entire system.
In this guide, we'll walk through implementing OpenTelemetry in NestJS applications, from basic setup to production-ready configurations. You'll learn how to avoid common pitfalls like initialization order issues, configure automatic instrumentation, and optimize performance for high-traffic applications.
Why OpenTelemetry for NestJS Applications
OpenTelemetry is an open-source observability framework that standardizes how we collect and export telemetry data—traces, metrics, and logs—from our applications. Think of it as a universal translator for observability data, allowing you to switch between different monitoring backends without changing your instrumentation code.
For NestJS applications, OpenTelemetry acts as a:
- Performance detective: Automatically tracks request latency, database query times, and API call durations without manual instrumentation
- Distributed trace collector: Follows requests as they flow through microservices, message queues, and databases, maintaining context across async operations
- Error investigator: Captures exceptions with full stack traces and request context, making debugging production issues significantly easier
The beauty of OpenTelemetry lies in its automatic instrumentation capabilities. Once configured, it automatically instruments popular Node.js libraries used in NestJS applications: Express, Fastify, TypeORM, Prisma, and more, giving you instant visibility without touching your business logic.
Prerequisites
Before diving into the implementation, let's ensure your environment meets the requirements:
- Node.js: 18.19.0+ or 20.6.0+ (NestJS 11+ requires Node.js 20+)
- TypeScript: 5.0.4 or higher
- NestJS: 4.0+ (version 8.0+ recommended for optimal compatibility)
- Observability backend: We'll use SigNoz Cloud for instant setup
Note that while OpenTelemetry supports various backends, we're using SigNoz because it provides out of the box support for OpenTelemetry, including automatic RED metrics (Rate, Errors, Duration) and pre-built dashboards.
Implementation Roadmap
Getting OpenTelemetry running in your NestJS application involves five key steps. Each step builds on the previous one, so following the order is crucial:
- Install dependencies: Add OpenTelemetry SDK and auto-instrumentation packages
- Configure the tracer: Set up the SDK with proper exporters and sampling
- Initialize correctly: Start the tracer before NestJS bootstraps (this is critical!)
- Set environment variables: Configure your observability backend endpoints
- Verify and optimize: Confirm traces are flowing and tune for production
Let's walk through each step with practical examples and common pitfalls to avoid.
Step 1: Installing OpenTelemetry Dependencies
First, let's install the OpenTelemetry packages. These provide the core SDK and automatic instrumentation for NestJS:
npm install --save @opentelemetry/api@latest
npm install --save @opentelemetry/sdk-node@latest
npm install --save @opentelemetry/auto-instrumentations-node@^0.62.0
npm install --save @opentelemetry/exporter-trace-otlp-http@latest
npm install --save @opentelemetry/sdk-trace-base@latest
What do these packages do?
@opentelemetry/api: The core API that your application code can optionally use for custom instrumentation@opentelemetry/sdk-node: The Node.js SDK that manages trace collection and export@opentelemetry/auto-instrumentations-node: The magic package that automatically instruments Express, Fastify, HTTP clients, and database drivers@opentelemetry/exporter-trace-otlp-http: Exports traces using the OpenTelemetry Protocol (OTLP)@opentelemetry/sdk-trace-base: Base tracing utilities for custom configurations
Step 2: Creating the Tracer Configuration
Now comes the heart of your OpenTelemetry setup. Create a tracer.ts file in your project root. This file configures how traces are collected, processed, and exported:
import { NodeSDK } from '@opentelemetry/sdk-node';
import { getNodeAutoInstrumentations } from '@opentelemetry/auto-instrumentations-node';
import { OTLPTraceExporter } from '@opentelemetry/exporter-trace-otlp-http';
import { ConsoleSpanExporter } from '@opentelemetry/sdk-trace-base';

// Configure trace exporter - use console for development debugging
const debugExporter = new ConsoleSpanExporter();
const traceExporter = process.env.NODE_ENV === 'development'
  ? debugExporter
  : new OTLPTraceExporter({
      url: process.env.OTEL_EXPORTER_OTLP_TRACES_ENDPOINT || 'https://ingest.us.signoz.cloud:443/v1/traces',
      headers: {
        'signoz-ingestion-key': process.env.SIGNOZ_INGESTION_KEY || '',
      },
    });

// Create SDK instance with comprehensive configuration
const sdk = new NodeSDK({
  traceExporter,
  instrumentations: [
    getNodeAutoInstrumentations({
      // Disable instrumentations that might cause issues
      '@opentelemetry/instrumentation-fs': { enabled: false },
      // Configure HTTP instrumentation for better trace context
      '@opentelemetry/instrumentation-http': {
        enabled: true,
        ignoreIncomingRequestHook: (req) => {
          // Ignore health check endpoints
          return req.url?.includes('/health') || req.url?.includes('/metrics') || false;
        },
      },
    }),
  ],
});

export default sdk;
This configuration does several important things:
- Development debugging: Uses ConsoleSpanExporter in development so you can see traces in your terminal
- Production export: Sends traces to your observability backend using OTLP
- Selective instrumentation: Disables file system instrumentation (which can be noisy) while keeping HTTP instrumentation
- Health check filtering: Prevents health check endpoints from cluttering your traces
Step 3: The Critical Initialization Order
Here's where most developers hit their first roadblock. OpenTelemetry must be initialized before NestJS imports any modules that need instrumentation. Get this wrong, and you'll wonder why your traces are missing.
The golden rule: Import and start the tracer before anything else.
// THIS MUST BE THE FIRST IMPORT
import tracer from './tracer';

// Now import NestJS and other application modules
import { NestFactory } from '@nestjs/core';
import { AppModule } from './app.module';
import { Logger } from '@nestjs/common';

async function bootstrap() {
  const logger = new Logger('Bootstrap');

  try {
    // Start tracer immediately before creating the app
    await tracer.start();

    const app = await NestFactory.create(AppModule);

    app.setGlobalPrefix('api');
    app.enableCors();

    const port = process.env.PORT || 3000;
    await app.listen(port);

    logger.log(`Application running on: http://localhost:${port}/api`);
  } catch (error) {
    logger.error('Error starting application:', error);
    process.exit(1);
  }
}

bootstrap();
Why is the order so important? OpenTelemetry works by "monkey-patching" Node.js modules before they're loaded. If NestJS loads Express or your database driver before OpenTelemetry patches them, you'll miss those traces entirely.
Step 4: Environment Configuration
Now let's configure where your traces should go. If you're using SigNoz Cloud (recommended for quick setup), you'll need these environment variables:
# Service identification
OTEL_SERVICE_NAME=your-nestjs-app
OTEL_SERVICE_VERSION=1.0.0

# SigNoz Cloud configuration
OTEL_EXPORTER_OTLP_TRACES_ENDPOINT=https://ingest.<region>.signoz.cloud:443/v1/traces
OTEL_EXPORTER_OTLP_HEADERS=signoz-ingestion-key=<your-ingestion-key>

# Environment
NODE_ENV=production

# Optional: Additional resource attributes
OTEL_RESOURCE_ATTRIBUTES=service.name=your-nestjs-app,service.version=1.0.0
Three critical values to configure:
- OTEL_SERVICE_NAME: How your service appears in traces (keep it consistent across deployments)
- OTEL_EXPORTER_OTLP_TRACES_ENDPOINT: Where to send your traces
- OTEL_EXPORTER_OTLP_HEADERS: Authentication for your observability backend
Setting Up Your Observability Backend
To see your traces in action, you'll need an observability backend. Here's how to get started with SigNoz Cloud:
- Sign up for SigNoz Cloud: Create a free 30-day trial account
- Get your ingestion key: Navigate to Settings → Ingestion Settings → New Ingestion Key
- Note your region: Your SigNoz URL includes the region (us, eu, or in)
- Configure and deploy: Add the environment variables to your application
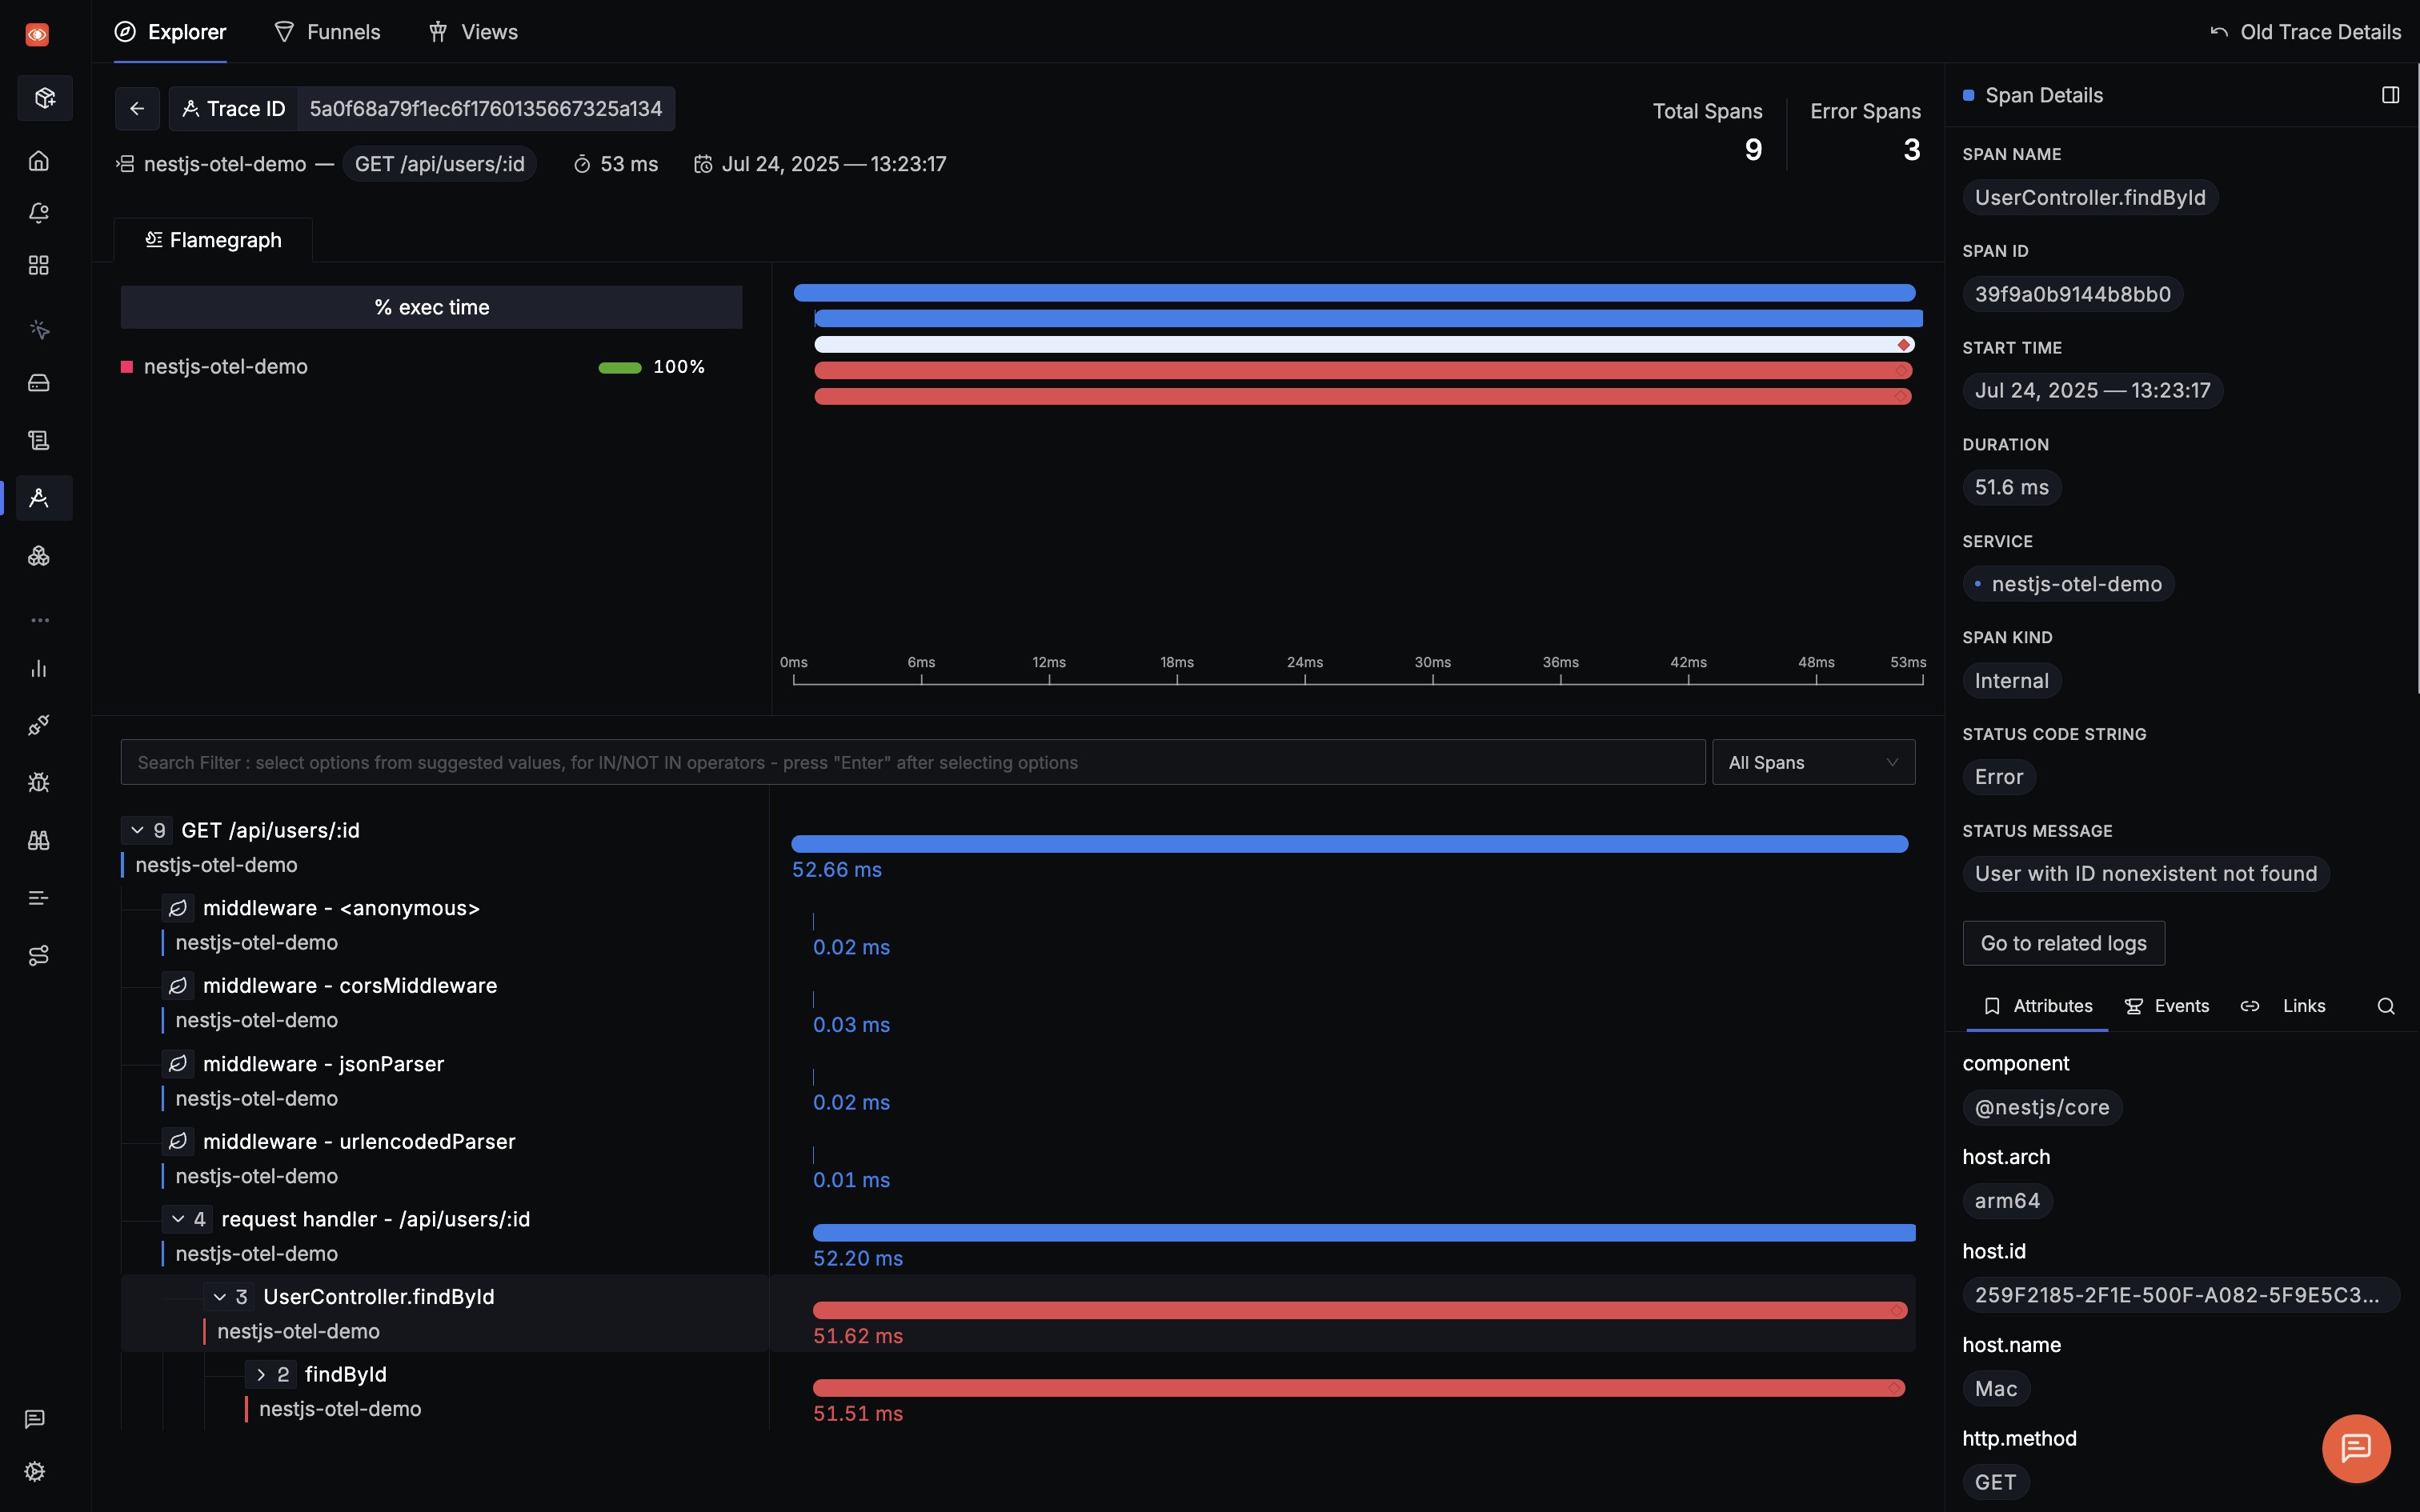
Within minutes of deploying with these configurations, you'll see traces flowing into your SigNoz dashboard. Each trace shows the complete request journey—from the initial HTTP request through database queries and external API calls.
When something goes wrong (like a payment service timeout), you'll see exactly where the failure occurred, how long each operation took, and what the error message was:
Beyond Automatic: Custom Instrumentation
Automatic instrumentation gets you 80% of the way there. But what about your business-critical operations—the complex calculations, third-party integrations, or multi-step workflows that define your application?
That's where custom instrumentation shines. Let's create a decorator that makes adding custom spans as simple as adding @Traced() to your methods:
import { trace, context, SpanStatusCode } from '@opentelemetry/api';

export function Traced(spanName?: string) {
  return function (target: any, propertyKey: string, descriptor: PropertyDescriptor) {
    const originalMethod = descriptor.value;
    const tracer = trace.getTracer('nestjs-app', '1.0.0');

    descriptor.value = async function (...args: any[]) {
      const finalSpanName = spanName || `${target.constructor.name}.${propertyKey}`;

      return await tracer.startActiveSpan(finalSpanName, async (span) => {
        try {
          span.setAttributes({
            'method.class': target.constructor.name,
            'method.name': propertyKey,
          });

          const result = await originalMethod.apply(this, args);
          span.setStatus({ code: SpanStatusCode.OK });
          return result;

        } catch (error) {
          span.recordException(error);
          span.setStatus({
            code: SpanStatusCode.ERROR,
            message: error.message
          });
          throw error;
        } finally {
          span.end();
        }
      });
    };

    return descriptor;
  };
}

// Usage in your services
@Injectable()
export class UserService {
  @Traced('user_creation')
  async createUser(userData: CreateUserDto): Promise<User> {
    // Your business logic
  }

  @Traced() // Uses default name: UserService.findById
  async findById(id: string): Promise<User> {
    // Your business logic
  }
}
This decorator pattern keeps your code clean while adding powerful observability. Each decorated method automatically:
- Creates a new span with timing information
- Captures method parameters as span attributes
- Records exceptions with full stack traces
- Sets appropriate span status based on success or failure
Tracing Database Operations
Database queries often represent the biggest performance bottlenecks in web applications. While auto-instrumentation captures basic database operations, adding custom spans for complex queries provides deeper insights:
import { Injectable } from '@nestjs/common';
import { InjectRepository } from '@nestjs/typeorm';
import { Repository } from 'typeorm';
import { trace, SpanStatusCode } from '@opentelemetry/api';
import { User } from './entities/user.entity';

@Injectable()
export class UserRepository {
  private readonly tracer = trace.getTracer('database', '1.0.0');

  constructor(
    @InjectRepository(User)
    private readonly userRepository: Repository<User>
  ) {}

  async findUsersWithFilters(filters: UserFilters): Promise<User[]> {
    return await this.tracer.startActiveSpan('complex_user_query', async (span) => {
      try {
        span.setAttributes({
          'db.operation': 'select',
          'db.table': 'users',
          'query.filters': JSON.stringify(filters)
        });

        const queryBuilder = this.userRepository
          .createQueryBuilder('user')
          .leftJoinAndSelect('user.profile', 'profile');

        if (filters.email) {
          queryBuilder.where('user.email LIKE :email', {
            email: `%${filters.email}%`
          });
        }

        const users = await queryBuilder.getMany();

        span.setAttributes({
          'query.result_count': users.length,
        });

        span.setStatus({ code: SpanStatusCode.OK });
        return users;

      } catch (error) {
        span.recordException(error);
        span.setStatus({
          code: SpanStatusCode.ERROR,
          message: error.message
        });
        throw error;
      } finally {
        span.end();
      }
    });
  }
}
This pattern captures valuable context about your database operations:
- Query type and target table
- Filter parameters (be careful not to log sensitive data)
- Result count for understanding query efficiency
- Detailed error information when queries fail
Microservices: Maintaining Trace Context
The real power of OpenTelemetry shines when you're running microservices. A single user request might touch your API gateway, authentication service, order service, and payment service. Without proper context propagation, you'd see four disconnected traces instead of one cohesive flow.
Here's how to ensure your traces stay connected across service boundaries:
import { Injectable, Logger } from '@nestjs/common';
import { HttpService } from '@nestjs/axios';
import { trace, context, propagation } from '@opentelemetry/api';
import { firstValueFrom } from 'rxjs';

@Injectable()
export class OrderService {
  private readonly logger = new Logger(OrderService.name);
  private readonly tracer = trace.getTracer('order-service', '1.0.0');

  constructor(private readonly httpService: HttpService) {}

  async createOrder(orderData: CreateOrderDto): Promise<Order> {
    return await this.tracer.startActiveSpan('create_order', async (span) => {
      try {
        span.setAttributes({
          'order.user_id': orderData.userId,
          'order.items_count': orderData.items.length,
          'order.total_amount': orderData.totalAmount,
        });

        // Process payment with context propagation
        const paymentResult = await this.processPayment(orderData);

        // Create order record
        const order = await this.saveOrder(orderData, paymentResult);

        span.setStatus({ code: SpanStatusCode.OK });
        return order;

      } catch (error) {
        span.recordException(error);
        span.setStatus({
          code: SpanStatusCode.ERROR,
          message: error.message
        });
        throw error;
      } finally {
        span.end();
      }
    });
  }

  private async processPayment(orderData: CreateOrderDto): Promise<PaymentResult> {
    return await this.tracer.startActiveSpan('process_payment', async (span) => {
      try {
        // Create headers with trace context for downstream service
        const headers = {};
        propagation.inject(context.active(), headers);

        const paymentRequest = {
          userId: orderData.userId,
          amount: orderData.totalAmount,
          paymentMethod: orderData.paymentMethod,
        };

        const response = await firstValueFrom(
          this.httpService.post('http://payment-service:3003/api/process',
            paymentRequest,
            { headers }
          )
        );

        span.setAttributes({
          'payment.transaction_id': response.data.transactionId,
          'payment.amount': orderData.totalAmount,
          'payment.status': response.data.status,
        });

        span.setStatus({ code: SpanStatusCode.OK });
        return response.data;

      } catch (error) {
        span.recordException(error);
        span.setStatus({
          code: SpanStatusCode.ERROR,
          message: error.message
        });
        throw error;
      } finally {
        span.end();
      }
    });
  }
}
The magic happens in these two lines:
const headers = {};
propagation.inject(context.active(), headers);
This injects the current trace context into HTTP headers, which the receiving service can extract to continue the same trace. The result? You can follow a request from your frontend through multiple services and see exactly where time is spent.
Production Performance Optimization
Running OpenTelemetry in production requires balancing observability with performance. Tracing every single request in a high-traffic application can overwhelm your observability backend and impact application performance.
Here's a production-optimized configuration that maintains visibility while minimizing overhead:
import { NodeSDK } from '@opentelemetry/sdk-node';
import { TraceIdRatioBasedSampler, ParentBasedSampler, BatchSpanProcessor } from '@opentelemetry/sdk-trace-base';
import { Resource } from '@opentelemetry/resources';
import { SemanticResourceAttributes } from '@opentelemetry/semantic-conventions';

const isProduction = process.env.NODE_ENV === 'production';

// Production-optimized configuration
const sdk = new NodeSDK({
  // Sample 10% of traces in production, 100% in development
  sampler: new ParentBasedSampler({
    root: new TraceIdRatioBasedSampler(isProduction ? 0.1 : 1.0),
  }),

  // Batch export for better performance
  spanProcessor: new BatchSpanProcessor(traceExporter, {
    maxExportBatchSize: isProduction ? 200 : 50,
    exportTimeoutMillis: isProduction ? 5000 : 2000,
    scheduledDelayMillis: isProduction ? 2000 : 1000,
  }),

  resource: new Resource({
    [SemanticResourceAttributes.SERVICE_NAME]: process.env.OTEL_SERVICE_NAME,
    [SemanticResourceAttributes.SERVICE_VERSION]: process.env.OTEL_SERVICE_VERSION,
    [SemanticResourceAttributes.DEPLOYMENT_ENVIRONMENT]: process.env.NODE_ENV,
  }),

  instrumentations: [
    getNodeAutoInstrumentations({
      // Disable high-volume instrumentation in production
      '@opentelemetry/instrumentation-fs': { enabled: false },
      '@opentelemetry/instrumentation-dns': { enabled: false },

      '@opentelemetry/instrumentation-http': {
        enabled: true,
        ignoreIncomingRequestHook: (req) => {
          const ignorePaths = ['/health', '/metrics', '/favicon.ico'];
          return ignorePaths.some(path => req.url?.includes(path));
        },
      },
    }),
  ],
});
Key optimization strategies:
| Strategy | Development | Production | Impact |
|---|---|---|---|
| Sampling rate | 100% | 10% | Reduces data volume by 90% |
| Batch size | 50 spans | 200 spans | Fewer network requests |
| Export timeout | 2 seconds | 5 seconds | Better tolerance for network issues |
| Ignored paths | Basic | Comprehensive | Eliminates noise from health checks |
Preventing Memory Leaks
OpenTelemetry maintains internal state for active spans and trace context. Without proper cleanup, long-running NestJS applications can experience memory leaks. Here's how to implement graceful shutdown:
import { Injectable, OnModuleDestroy, Logger } from '@nestjs/common';
import { NodeSDK } from '@opentelemetry/sdk-node';

@Injectable()
export class TelemetryService implements OnModuleDestroy {
  private readonly logger = new Logger(TelemetryService.name);
  private sdk: NodeSDK;

  async initializeTelemetry(): Promise<void> {
    try {
      this.sdk = new NodeSDK({
        // Your SDK configuration
      });

      await this.sdk.start();
      this.logger.log('OpenTelemetry SDK initialized successfully');

      // Handle process shutdown gracefully
      process.on('SIGTERM', () => this.shutdown());
      process.on('SIGINT', () => this.shutdown());

    } catch (error) {
      this.logger.error('Failed to initialize OpenTelemetry SDK:', error);
      throw error;
    }
  }

  async onModuleDestroy(): Promise<void> {
    await this.shutdown();
  }

  private async shutdown(): Promise<void> {
    try {
      if (this.sdk) {
        this.logger.log('Shutting down OpenTelemetry SDK...');
        await this.sdk.shutdown();
        this.logger.log('OpenTelemetry SDK shutdown complete');
      }
    } catch (error) {
      this.logger.error('Error during OpenTelemetry SDK shutdown:', error);
    }
  }
}
This service ensures:
- Pending spans are exported before shutdown
- Memory allocated for trace context is released
- Network connections to the observability backend are closed cleanly
Troubleshooting Common Issues
Even with careful implementation, you might encounter these common issues. Here's how to diagnose and fix them:
Issue 1: Missing Traces
Symptom: Your application runs but no traces appear in your observability backend.
Most common cause: Incorrect initialization order.
// ❌ WRONG - NestJS imports before tracer
import { NestFactory } from '@nestjs/core';
import tracer from './tracer';

// ✅ CORRECT - Tracer first
import tracer from './tracer';
await tracer.start();
import { NestFactory } from '@nestjs/core';
Quick debug method: Use ConsoleSpanExporter to verify traces are being generated:
import { ConsoleSpanExporter } from '@opentelemetry/sdk-trace-base';

// Temporarily use console exporter to verify traces are generated
const debugExporter = new ConsoleSpanExporter();

const sdk = new NodeSDK({
  traceExporter: process.env.NODE_ENV === 'development'
    ? debugExporter
    : traceExporter,
});
If you see traces in your console but not in your backend, check your endpoint configuration and network connectivity.
Issue 2: High Memory Usage
Symptom: Memory usage grows continuously in production.
Solution: Configure appropriate limits and sampling:
import { EventEmitter } from 'events';

// Increase max listeners limit for production
EventEmitter.defaultMaxListeners = 20;

// Use sampling to reduce memory pressure
const sdk = new NodeSDK({
  sampler: new TraceIdRatioBasedSampler(0.1), // 10% sampling
});
Issue 3: Broken Trace Context in Microservices
Symptom: Each service shows separate traces instead of one connected trace.
Solution: Ensure all services use compatible propagators:
import { CompositePropagator, TraceContextPropagator, BaggagePropagator } from '@opentelemetry/core';
import { B3Propagator } from '@opentelemetry/propagator-b3';

const sdk = new NodeSDK({
  textMapPropagator: new CompositePropagator({
    propagators: [
      new TraceContextPropagator(),  // W3C standard
      new BaggagePropagator(),        // For custom context
      new B3Propagator(),             // For Zipkin compatibility
    ],
  }),
});
See It in Action
Want to see all these concepts working together? Check out our complete NestJS OpenTelemetry demo that includes:
- Properly configured OpenTelemetry SDK
- Custom instrumentation examples
- Microservices with context propagation
- Production-ready configurations
Getting Started with SigNoz
SigNoz provides comprehensive monitoring and observability features specifically designed for NestJS applications. The platform automatically captures distributed traces, metrics, and logs from your instrumented NestJS application, supporting REST APIs, GraphQL endpoints, and microservices architectures.
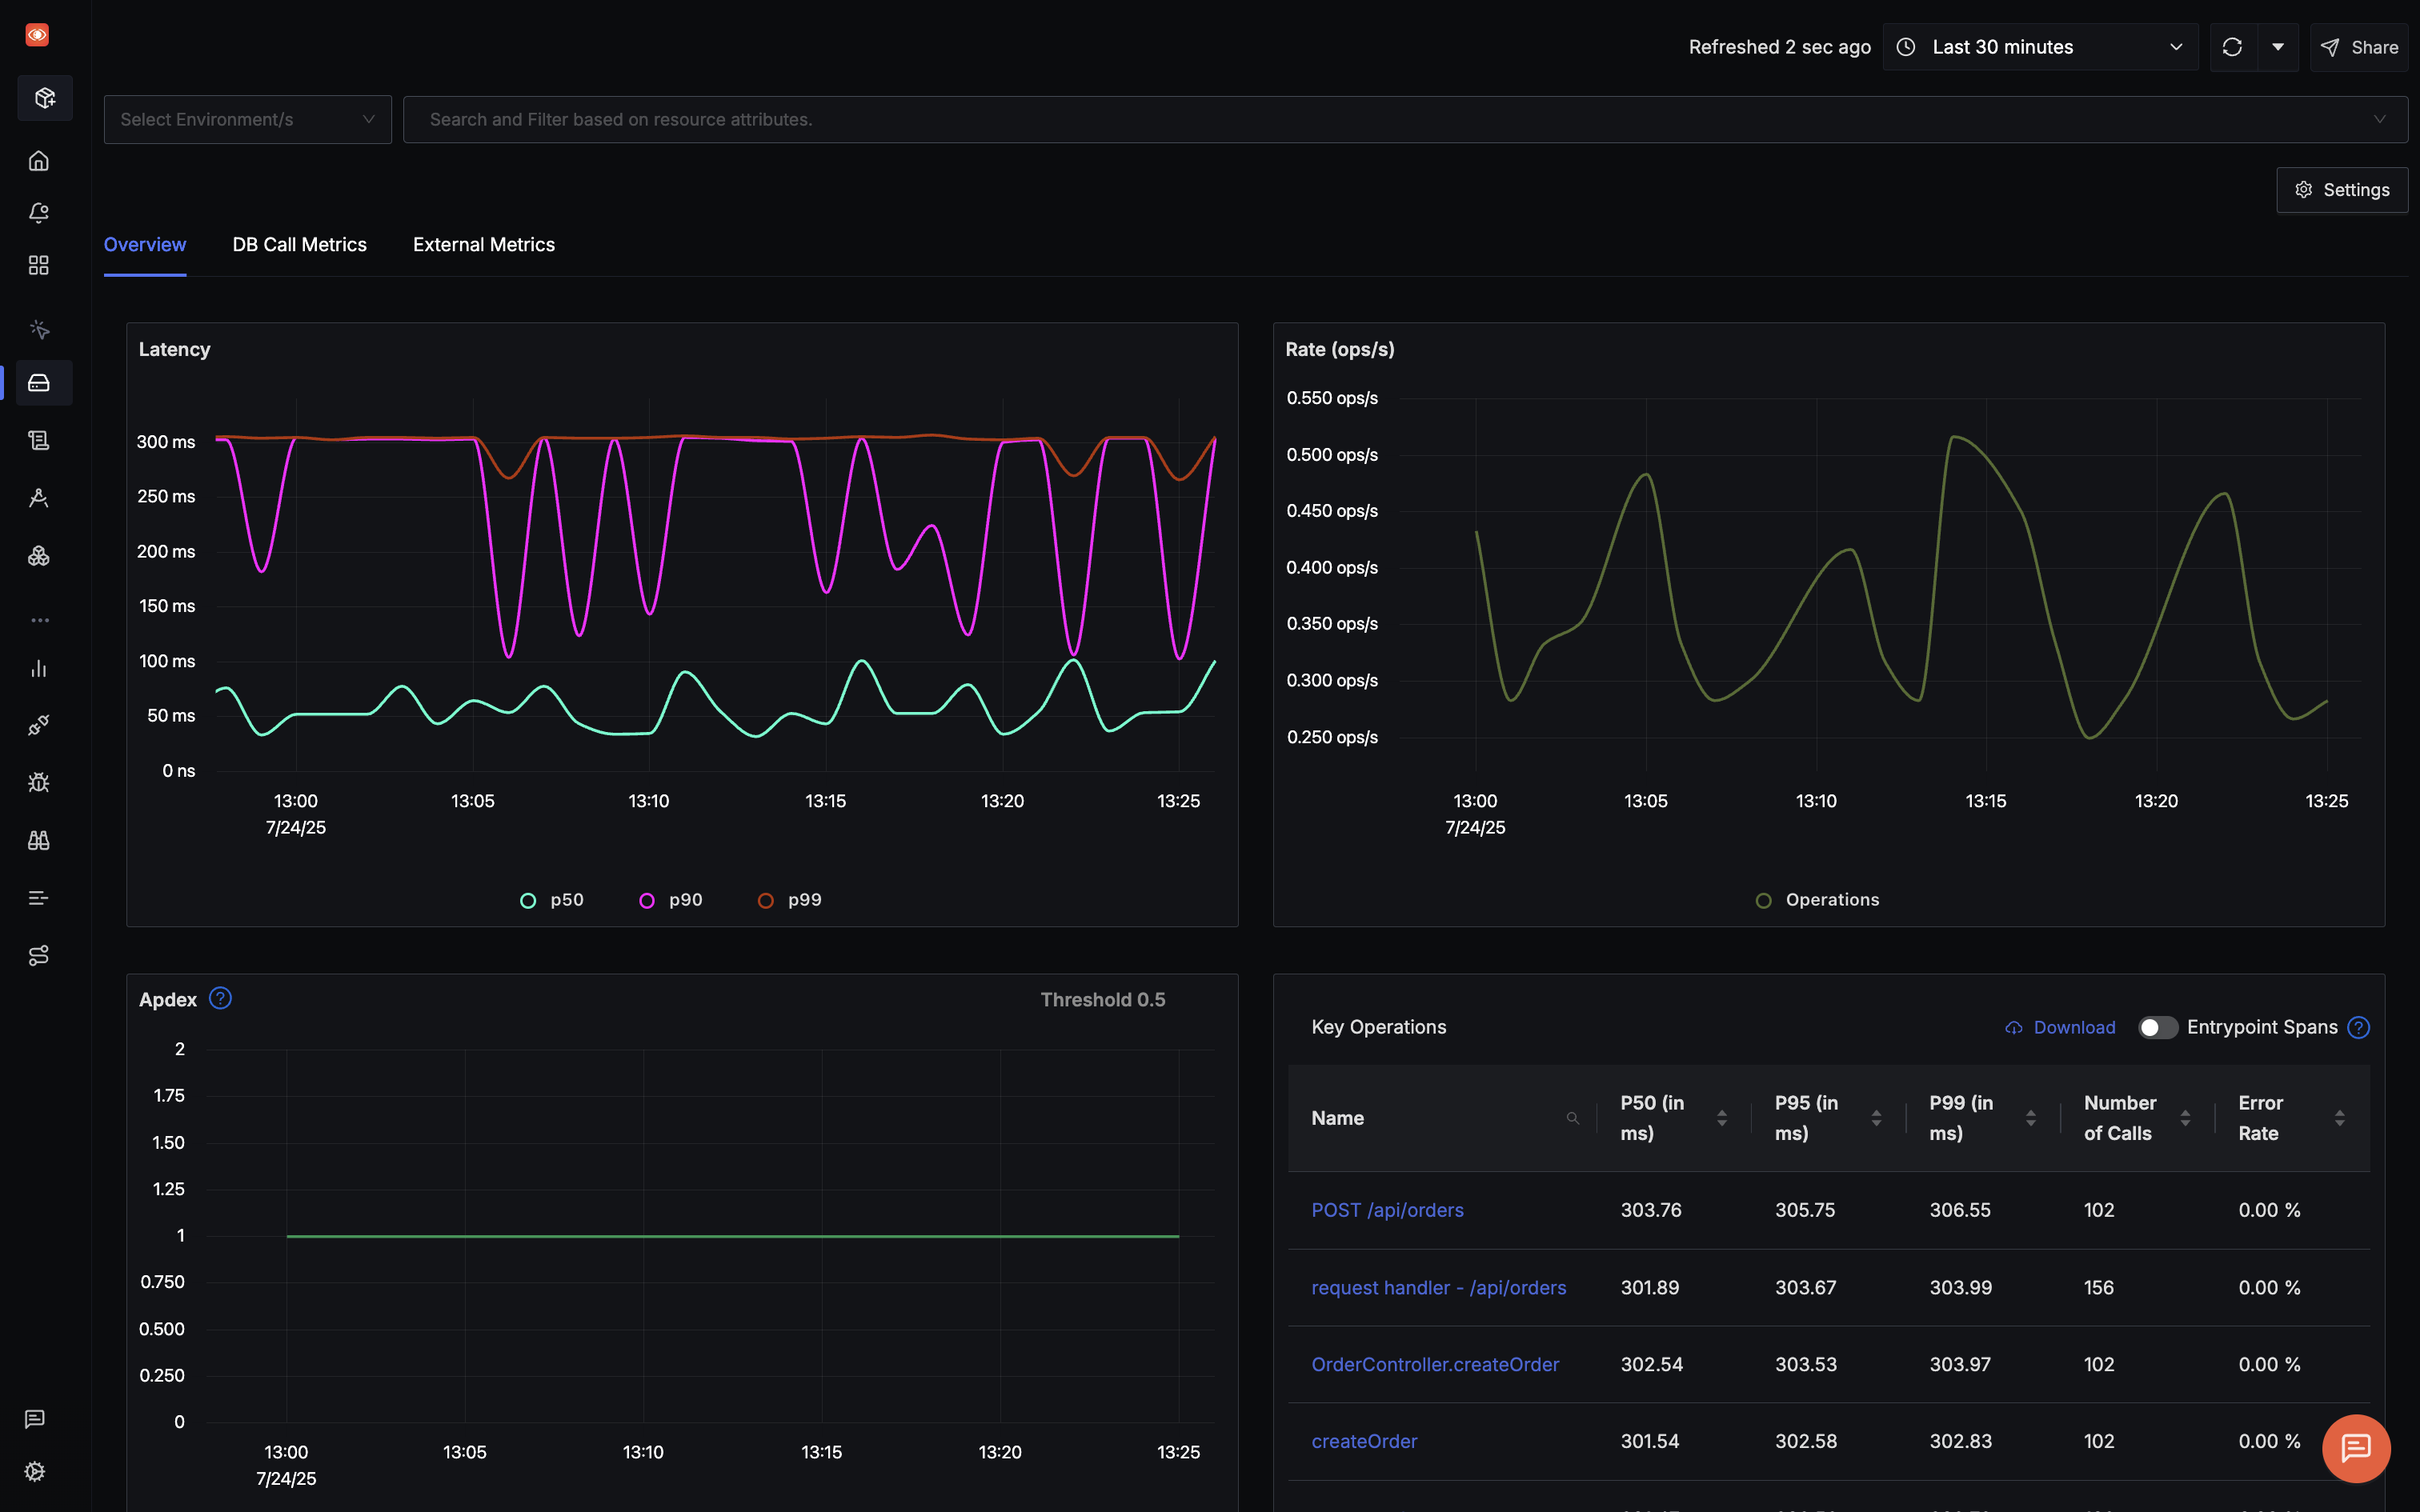
Key features for NestJS applications include:
- Automatic RED Metrics: Request Rate, Error Rate, and Duration visualization without manual configuration
- Distributed Tracing: End-to-end trace visualization across microservices with flamegraphs and Gantt charts
- Database Query Analysis: Deep insights into TypeORM, Prisma, and database performance
- Custom Business Metrics: Track specific NestJS service operations and business KPIs
- Real-time Alerting: Set up alerts for latency, error rates, and custom metrics
You can choose between various deployment options in SigNoz. The easiest way to get started with SigNoz is SigNoz cloud. We offer a 30-day free trial account with access to all features.
Those who have data privacy concerns and can't send their data outside their infrastructure can sign up for either enterprise self-hosted or BYOC offering.
Those who have the expertise to manage SigNoz themselves or just want to start with a free self-hosted option can use our community edition.
Hope we answered all your questions regarding OpenTelemetry NestJS implementation. If you have more questions, feel free to use the SigNoz AI chatbot, or join our slack community.
Conclusion
Implementing OpenTelemetry in your NestJS application transforms debugging from guesswork to data-driven investigation. With proper setup, you gain visibility into every request, database query, and service interaction, all with minimal performance overhead.
The key takeaways for successful implementation:
- Initialize early: Always start the tracer before importing NestJS modules
- Start with auto-instrumentation: Get immediate value without changing your code
- Add custom spans strategically: Focus on business-critical operations
- Optimize for production: Use sampling and batch processing to control overhead
- Monitor across services: Maintain trace context for true end-to-end visibility
Whether you're troubleshooting a production issue at 3 AM or optimizing database queries for better performance, OpenTelemetry gives you the insights you need. Combined with a powerful analysis platform like SigNoz, you can move from reactive firefighting to proactive performance optimization.
Ready to see the difference? Implement OpenTelemetry in your NestJS application today and experience the confidence that comes from truly understanding your system's behavior.
Frequently Asked Questions
What's the minimum Node.js version for OpenTelemetry?
OpenTelemetry requires Node.js 18.19.0+ or 20.6.0+. If you're using NestJS 11+, Node.js 20+ is mandatory.
How do I debug missing traces?
First, use ConsoleSpanExporter to verify traces are being generated locally. Then check:
- Initialization order (tracer before NestJS imports)
- Environment variables are correctly set
- Network connectivity to your backend
What's the performance impact?
With proper configuration:
- Development (100% sampling): 10-15% overhead
- Production (10% sampling): 5-10% overhead
- Optimized setup: As low as 2-5% overhead
Does it work with GraphQL?
Yes! HTTP instrumentation captures GraphQL requests automatically. For resolver-level tracing, add custom spans using the @Traced decorator pattern.
Should I trace everything?
No. Start with automatic instrumentation, then add custom tracing for:
- Business-critical operations
- Known performance bottlenecks
- Complex async workflows
- Third-party API integrations
How do I connect logs with traces?
Extract trace context and add to your logs:
const span = trace.getActiveSpan();
if (span) {
  const { traceId, spanId } = span.spanContext();
  logger.log(`Processing order`, { traceId, spanId, orderId });
}
