When your NGINX server starts experiencing issues, whether it's slow response times, failed requests, or security threats, your first instinct is to check the logs. But what if your logs aren't capturing the right information? Or worse, what if you can't make sense of the data they're recording?
Whether you're troubleshooting a production incident at 2 AM or analyzing traffic patterns to optimize performance, your NGINX logging configuration can make the difference between quick resolution and prolonged downtime.
This guide covers everything from basic log configuration to advanced topics like performance optimization, security considerations, and integration with modern observability platforms. You'll gain a complete understanding of NGINX logging and the skills to implement robust log management for your applications.
Understanding NGINX Logging Fundamentals
Before diving into specific configurations, let's understand how NGINX logging works at its core. NGINX provides two primary types of logs through dedicated directives, each serving distinct purposes in your monitoring strategy:
error_logcaptures server-side issues, configuration errors, and operational problemsaccess_logrecords every client request processed by NGINX, providing insights into traffic patterns and user behavior
These logs are essential for maintaining web server health, troubleshooting issues, analyzing user behavior, and ensuring security compliance. The beauty of NGINX logging lies in its flexibility, you can customize what gets logged, where it gets stored, and how it's formatted to match your specific operational needs.
NGINX Access Logs: Configuration and Customization
Now that you understand the fundamentals, let's explore how to configure access logs effectively. Access logs are configured in your NGINX configuration file (typically located at /etc/nginx/nginx.conf or within your site-specific configuration files in /etc/nginx/sites-available/).
The basic syntax for access log configuration involves two key components: defining a log format and applying it to a log file. Let's walk through this process step by step.
Understanding Access Log Formats
NGINX offers several predefined log formats, with combined being the most commonly used. The combined log format is a standard format that includes essential client request details, making it ideal for most web applications and analysis tools:
log_format combined '$remote_addr - $remote_user [$time_local] '
                   '"$request" $status $body_bytes_sent '
                   '"$http_referer" "$http_user_agent"';
This format captures the following variables:
- $remote_addr: Client IP address
- $time_local: Timestamp when request was processed
- $request: Full HTTP request line
- $status: HTTP response status code
- $body_bytes_sent: Size of response body in bytes
- $http_referer: Referrer URL
- $http_user_agent: Browser/client information
An example log entry using the combined format looks like this:
192.168.1.10 - - [30/Jul/2025:15:57:19 +0000] "GET /index.html HTTP/1.1" 200 1024 "http://example.com/start" "Mozilla/5.0 (Windows NT 10.0; Win64; x64)"
Custom Log Formats for Specific Use Cases
While the combined format works well for general purposes, you might need more specific information for your use case. Let's explore how to create tailored log formats to capture the data most relevant to your needs.
Performance Monitoring Format
When performance is critical, you'll want to track request timing metrics:
log_format performance '$remote_addr - $remote_user [$time_local] '
                       '"$request" $status $body_bytes_sent '
                       '"$request_time" "$upstream_response_time"';
This configuration adds request timing metrics to help identify slow requests and upstream performance issues. An example log entry shows:
192.168.1.10 - - [30/Jul/2025:15:57:19 +0000] "GET /api/users HTTP/1.1" 200 2048 "0.125" "0.098"
JSON Format for Structured Logging
For modern log analysis tools and better parsing, JSON format is increasingly popular:
log_format json_combined escape=json
'{
  "timestamp": "$time_iso8601",
  "remote_addr": "$remote_addr",
  "request": "$request",
  "status": "$status",
  "bytes_sent": "$body_bytes_sent",
  "request_time": "$request_time",
  "user_agent": "$http_user_agent"
}';
The escape=json directive ensures proper JSON formatting by escaping special characters, making logs compatible with modern log analysis tools.
Security-Focused Format
When security is a priority, especially in environments with load balancers or proxies, you'll want to capture the real client IP addresses:
log_format security '$remote_addr - [$time_local] "$request" '
                    '$status $body_bytes_sent "$http_user_agent" '
                    '"$http_x_forwarded_for"';
This format includes the $http_x_forwarded_for header to capture real IP addresses when NGINX sits behind a load balancer or proxy.
Implementing Conditional Logging
As your traffic grows, you might want to reduce log volume while maintaining visibility into important events. Conditional logging allows you to be selective about what gets recorded:
# Map to determine what should be logged
map $status $loggable {
    ~^[23]  0;  # Don't log 2xx and 3xx responses
    default 1;  # Log everything else
}

# Apply conditional logging
access_log /var/log/nginx/access.log combined if=$loggable;
This approach filters out successful responses while logging errors and redirects. It's particularly useful for:
- Filtering out successful health checks
- Logging only error responses (4xx/5xx)
- Excluding bot traffic or specific user agents
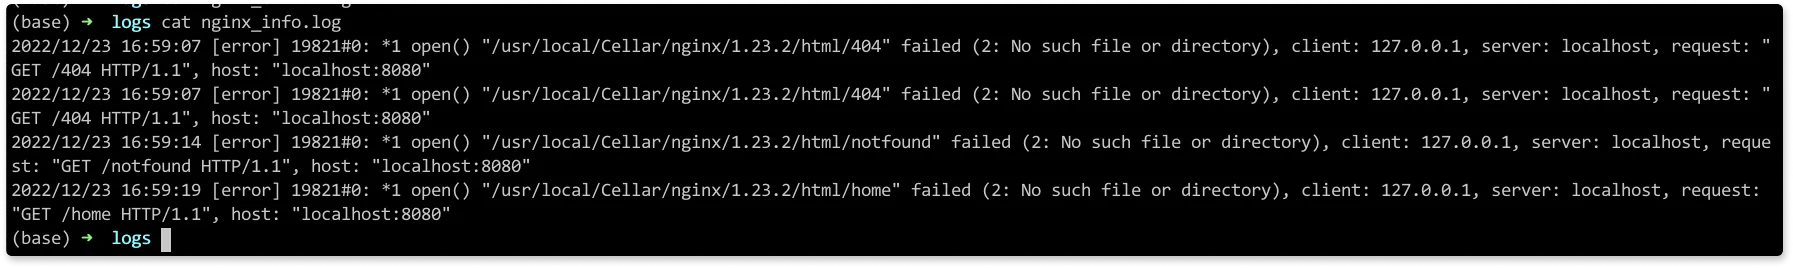
NGINX Error Logs: Severity Levels and Configuration
While access logs tell you what happened, error logs tell you what went wrong. Understanding how to configure error logs effectively is crucial for maintaining system health and quickly resolving issues when they occur.
Error logs in NGINX are configured using the error_log directive, which can be placed in the main configuration context, http block, server block, or location block, depending on the scope of logging you need.
Error Log Severity Levels
NGINX categorizes error messages into eight severity levels, each serving different diagnostic purposes:
| Level | Description | Use Case |
|---|---|---|
| debug | Detailed debugging information | Development and troubleshooting |
| info | Informational messages | General operational events |
| notice | Normal but significant events | Important operational changes |
| warn | Warning conditions | Potential issues requiring attention |
| error | Error conditions | Failed requests and server errors |
| crit | Critical conditions | Serious problems affecting functionality |
| alert | Immediate action required | System-level issues |
| emerg | System unusable | Emergency situations |
Setting the error log level determines which messages get recorded. For example, setting the level to warn will capture warn, error, crit, alert, and emerg messages, while filtering out info, notice, and debug messages.
Error Log Configuration Examples
Let's look at practical configurations for different scenarios:
Basic Configuration
The simplest error log configuration specifies a file location and minimum severity level:
error_log /var/log/nginx/error.log warn;
This configuration logs warning-level and higher severity messages to a single file, which is suitable for most production environments where you want to capture potential issues without overwhelming detail.
Multiple Log Files for Different Severities
For more granular control, you can configure multiple error logs with different severity levels:
error_log /var/log/nginx/error.log error;
error_log /var/log/nginx/critical.log crit;
error_log /var/log/nginx/debug.log debug;
Using multiple log files helps separate routine warnings from critical issues requiring immediate attention. Note that a message will go to all logs with a severity level equal to or less severe than the message’s level (e.g., a crit message will also be logged to error.log and debug.log).
Syslog Integration
For centralized log management, you can send error logs directly to a syslog server:
error_log syslog:server=192.168.1.100:514,facility=local7,tag=nginx error;
This sends error logs directly to a remote syslog server for centralized log management, which is particularly valuable in distributed environments.
Advanced Logging Configuration
As your NGINX deployment grows more complex, you'll likely need more sophisticated logging configurations. Let's explore advanced techniques that can provide deeper insights while maintaining performance.
Custom Log Formats with Performance Metrics
For applications where performance monitoring is critical, NGINX provides numerous variables for creating detailed log formats that capture timing information throughout the request lifecycle:
log_format comprehensive '$remote_addr - $remote_user [$time_local] '
                        '"$request" $status $body_bytes_sent '
                        '"$http_referer" "$http_user_agent" '
                        'rt=$request_time uct="$upstream_connect_time" '
                        'uht="$upstream_header_time" urt="$upstream_response_time"';
This format includes timing metrics for understanding where delays occur in your application stack:
rt: Total request processing timeuct: Time to establish connection with upstreamuht: Time to receive response headers from upstreamurt: Total response time from upstream
Implementing Log Sampling for High-Traffic Sites
For high-traffic environments, logging every single request can create performance bottlenecks and storage challenges. Log sampling allows you to maintain statistical relevance while reducing overhead:
# Sample 10% of requests based on a hash of the request ID
split_clients $request_id $sample_log {
            10% 1;
            *   0;
}

access_log /var/log/nginx/sampled.log combined if=$sample_log;
This approach maintains statistical relevance while significantly reducing log volume and disk I/O. You can adjust the sampling rate based on your traffic volume and storage capacity.
Configuring Multiple Log Destinations
Modern infrastructure often requires sending logs to multiple destinations simultaneously. NGINX supports this through multiple access_log directives:
access_log /var/log/nginx/access.log combined;
access_log /var/log/nginx/json.log json_combined;
access_log syslog:server=log.example.com:514 combined;
This configuration enables you to maintain local logs while also forwarding to centralized logging systems, providing both local access for immediate troubleshooting and centralized analysis for long-term monitoring.
Performance Optimization for NGINX Logging
While logging is essential, it shouldn't come at the cost of application performance. Let's explore techniques to optimize your logging configuration for high-performance environments.
Asynchronous Logging with Buffering
One of the most effective ways to improve logging performance is through buffering. Instead of writing each log entry immediately to disk, NGINX can buffer entries in memory:
access_log /var/log/nginx/access.log combined buffer=32k flush=5s;
This configuration buffers up to 32KB of log data in memory and flushes to disk every 5 seconds or when the buffer is full. This significantly reduces disk I/O operations, especially important for high-traffic sites where frequent disk writes can impact performance.
Log File Cache Optimization
NGINX can also optimize file descriptor handling through log file caching:
open_log_file_cache max=1000 inactive=20s valid=1m min_uses=2;
The parameters work as follows:
- max=1000: Cache up to 1000 log file descriptors
- inactive=20s: Remove unused descriptors after 20 seconds
- valid=1m: Revalidate file existence every minute
- min_uses=2: Cache only files accessed at least twice
Managing Log Rotation
Proper log rotation prevents disk space issues and maintains system performance. Here's a production-ready logrotate configuration:
# /etc/logrotate.d/nginx
/var/log/nginx/*.log {
    daily
    missingok
    rotate 52
    compress
    delaycompress
    notifempty
    create 644 nginx nginx
    postrotate
        systemctl reload nginx
    endscript
}
This configuration rotates logs daily, keeps 52 weeks of history, and compresses old logs to save disk space while ensuring NGINX continues logging without interruption.
Security Considerations for NGINX Logs
Logs often contain sensitive information, making security a critical consideration in your logging strategy. Let's explore how to protect this valuable but potentially sensitive data.
Protecting Sensitive Information
When logs contain sensitive data, implementing proper security measures is essential for both operational security and compliance requirements.
File Permissions
Start with basic file system security by restricting access to log files:
# Secure log file permissions
chmod 640 /var/log/nginx/*.log
chown nginx:adm /var/log/nginx/*.log
Restricting file permissions ensures only authorized users can access log files, reducing the risk of sensitive information exposure.
Data Masking for Privacy Compliance
For privacy compliance (such as GDPR), you might need to mask or anonymize certain data elements:
# Mask IP addresses for privacy compliance
map $remote_addr $masked_ip {
    ~(?P<ip>\d+\.\d+\.\d+)\.\d+ $ip.xxx;
}

log_format privacy '$masked_ip - $remote_user [$time_local] '
                   '"$request" $status $body_bytes_sent';
This configuration masks the last octet of IP addresses to comply with privacy regulations while maintaining network segment information for analysis.
GDPR and Privacy Compliance
For GDPR compliance, consider implementing comprehensive privacy protection measures:
- Implementing log retention policies that automatically delete old logs
- Masking or hashing personally identifiable information
- Providing mechanisms for data deletion requests
- Securing log transmission and storage with encryption
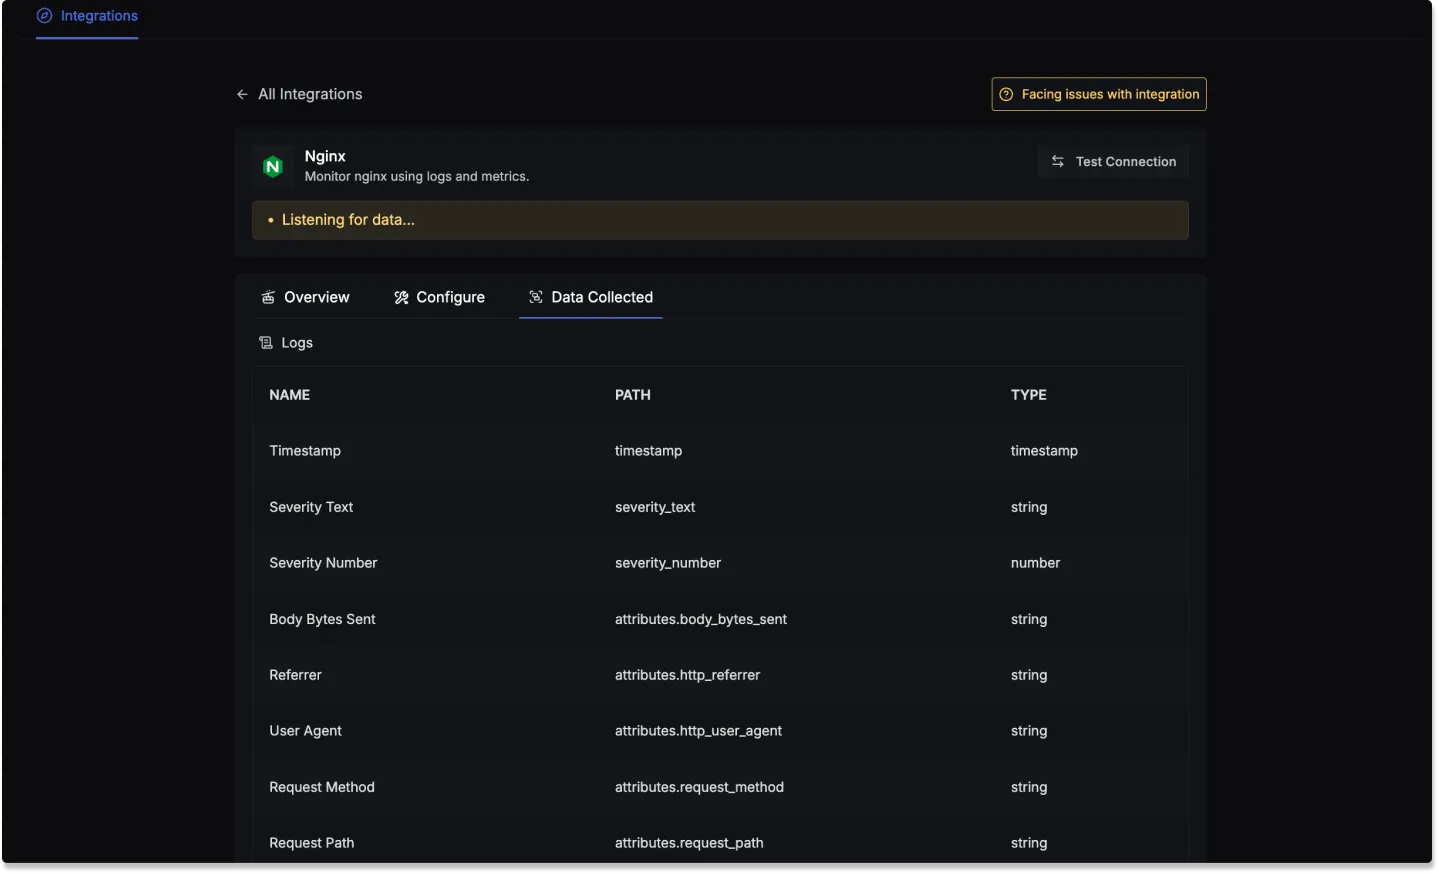
Integration with OpenTelemetry and SigNoz for Advanced Observability
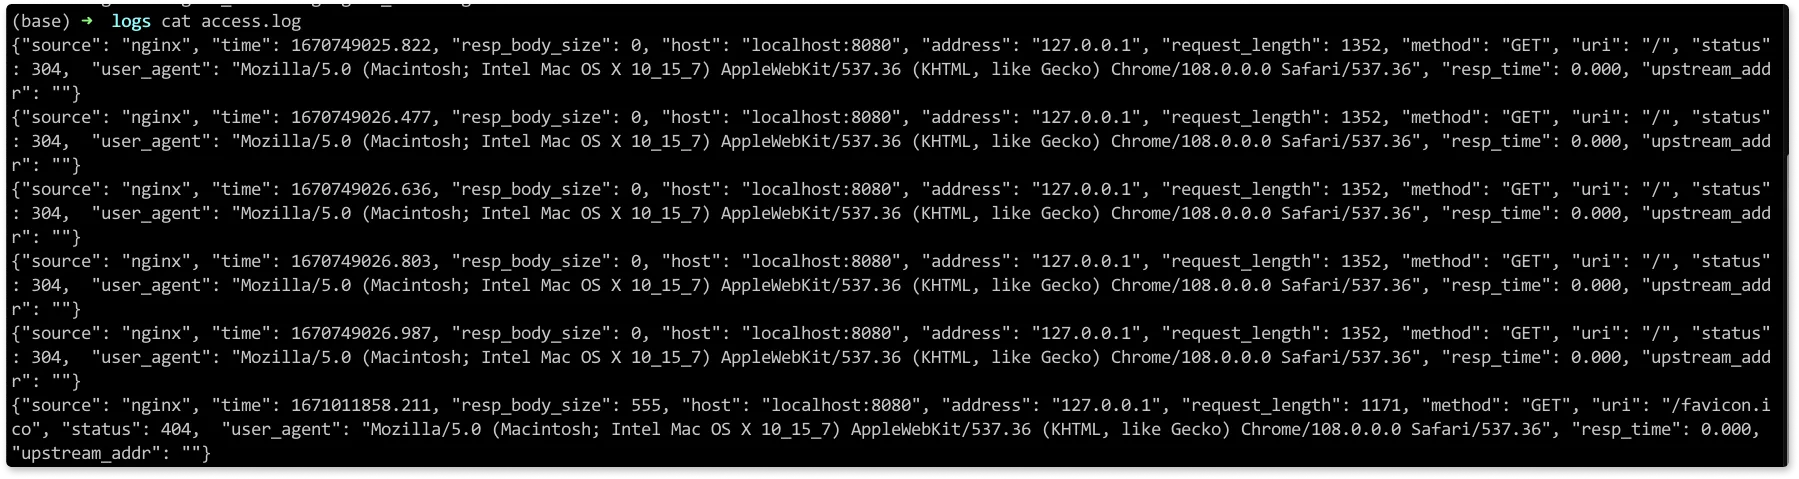
Modern observability requires integrating logs with metrics and traces for a complete view of system performance. SigNoz is a one-stop observability platform that provides comprehensive log management capabilities built on OpenTelemetry standards. By correlating logs with metrics and traces in a single platform, SigNoz offers unified observability for your NGINX servers.
For a detailed, step-by-step guide on configuring NGINX with SigNoz, you can follow the official documentation.
Get Started with SigNoz
You can choose between various deployment options in SigNoz. The easiest way to get started with SigNoz is SigNoz cloud. We offer a 30-day free trial account with access to all features.
Those who have data privacy concerns and can't send their data outside their infrastructure can sign up for either enterprise self-hosted or BYOC offering.
Those who have the expertise to manage SigNoz themselves or just want to start with a free self-hosted option can use our community edition.
Troubleshooting Common NGINX Logging Issues
Even with proper configuration, logging issues can arise. Let's address the most common problems and their solutions to keep your logging infrastructure running smoothly.
Logs Not Appearing
When logs aren't being generated or written, there are several common causes to investigate:
Permission Issues are often the culprit:
# Check log directory permissions
ls -la /var/log/nginx/
# Fix permissions if needed
sudo chown -R nginx:nginx /var/log/nginx/
sudo chmod 755 /var/log/nginx/
Disk Space Issues can prevent log writing:
# Check available disk space
df -h /var/log/
# Clear old logs if necessary
sudo find /var/log/nginx/ -name "*.log.*" -mtime +30 -delete
Configuration Errors might prevent logging from starting:
# Test NGINX configuration
sudo nginx -t
# Check for syntax errors in log directives
Performance Issues from Excessive Logging
When logging begins to impact application performance, optimization strategies can help:
Implement Log Sampling to reduce volume while maintaining visibility:
map $request_uri $skip_log {
    /health-check 0;
    /status 0;
    default 1;
}

access_log /var/log/nginx/access.log combined if=$skip_log;
This configuration excludes health check and status endpoints from logging while capturing all other requests.
Use Buffering to reduce I/O operations:
access_log /var/log/nginx/access.log combined buffer=64k flush=5s;
Optimize Log Format by removing unnecessary fields from custom log formats to reduce processing overhead and disk space usage.
Best Practices for Production Environments
Running NGINX logging in production requires careful attention to reliability, performance, and maintainability. Let's examine the key practices that ensure your logging infrastructure scales with your application.
Log Retention and Archival
Implementing a comprehensive log management strategy prevents storage issues while maintaining necessary historical data:
# Example logrotate configuration for production
/var/log/nginx/*.log {
    daily
    rotate 30
    compress
    delaycompress
    missingok
    notifempty
    sharedscripts
    postrotate
        systemctl reload nginx > /dev/null 2>&1
    endscript
}
This configuration maintains 30 days of logs locally while compressing older files to save storage space. The sharedscripts directive ensures the postrotate script runs only once even when multiple log files are rotated.
Monitoring Log Health
Setting up monitoring for your logging infrastructure ensures you'll know when problems occur:
Monitor Log Volume to detect unusual patterns:
# Check log growth rate
du -sh /var/log/nginx/access.log
Alert on Missing Logs: Create alerts when log files haven't been updated within expected timeframes. This can indicate NGINX issues, configuration problems, or disk space issues.
Monitor Error Rates: Track error log entries to identify trends and potential issues early. Sudden spikes in error rates often precede more serious problems.
Security Hardening
Production logging environments require additional security measures:
Restrict Log Access:
# Limit access to log files
chmod 640 /var/log/nginx/*.log
chown nginx:adm /var/log/nginx/*.log
Secure Log Transmission: When forwarding logs to external systems, use encrypted connections and authentication to protect sensitive data in transit.
Regular Log Auditing: Implement automated log analysis to detect unusual patterns or potential security threats. This might include unusual request patterns, suspicious user agents, or unexpected geographic distributions of requests.
Conclusion
Effective NGINX logging is crucial for maintaining web server performance, security, and reliability. By implementing the configurations and best practices outlined in this guide, you can:
- Set up comprehensive access and error logging with appropriate formats
- Optimize performance through buffering, sampling, and conditional logging
- Integrate with modern observability platforms like SigNoz for advanced analysis
- Implement security measures to protect sensitive data
- Troubleshoot common logging issues effectively
Start with basic configurations and gradually implement more advanced features as your monitoring needs grow. With proper NGINX logging in place, you'll have the visibility needed to maintain high-performance web services and quickly resolve any issues that arise.
Whether you're managing a single server or a fleet of NGINX instances, these principles and configurations will help you build a robust logging foundation that scales with your infrastructure needs.
Hope we answered all your questions regarding NGINX logging. If you have more questions, feel free to join and ask on our slack community.
You can also subscribe to our newsletter for insights from observability nerds at SigNoz — get open source, OpenTelemetry, and devtool-building stories straight to your inbox.
